When starting to work with a tool like Loadero, there can be many unknowns and things that need to be explored, before you can properly achieve your appointed goals for testing. If you are working on the first test, it’s a good idea to follow our step-by-step guide to configuring a test and check out Loadero’s documentation if something is unclear. To further ease your work on creating a test and checking that it is ready for a test run in this blog post we point out the most common mistakes users should avoid while creating new tests and continuing using existing ones.
We will be covering these points in this post:
- Checking your test parameters and script.
- Correct setting of the participant timeout.
- Checking that the start interval setting is aligned with your plans.
- Not waiting for a page/element to fully load and become intractable.
- Not incorporating pauses within your WebRTC tests.
- Setting too low of a compute unit (further referred to as CU) setting for test participants.
- Not doing small-scale test runs with the developed script before running larger scale load tests.
- Aborting test runs.
So let’s get started with addressing/explaining the most common mistakes.
Checking your test parameters and script
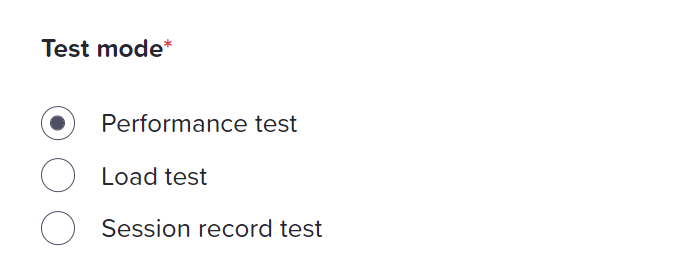
Tip: While test participant count does not exceed 50 participants we suggest always running your tests in performance mode to get as much data about the test run as possible.
One of the first parameters users choose for their tests is the Test mode. If you plan to run a large-scale load test with a high number of concurrent users, but are currently running it with 50 participants or less, it is always a good idea to use the Performance test mode. This mode provides all the metrics the Load test mode does, but its Selenium logs are more verbose, it provides machine statistics for each participant and allows you to use the file downloads feature. This can help you a lot to understand how the test behaves and help you debug it. Once you are ready to scale the test up for a higher number of participants, you’ll just have to change the test mode.
Correct setting of the Participant timeout

Setting the correct test participant timeout and start interval according to your plans for the test is important. An incorrect setting can cause other test run results rather than success, test participants starting test script execution in an unexpected order or finishing the test too early. So to address this, I will explain what these fields are and how they interact within the scope of the test run.
So, first of all, let’s start with participant timeout.
Important: The short rule about the Participant timeout is: it always has to be longer than executing the whole test script would take.
Participant timeout value indicates what will be the maximum timeout for each of the test participants from the moment the participant started its test execution till it either finishes the configured test script or the specified timeout value has been reached. Once the timeout is reached, forceful termination of the test script execution will start for a participant. In such a case it is not guaranteed that all relevant information for that test participant will be collected, so this should be avoided if possible. If the participant has forceful test script termination its status in test results will also be set to timeout value. For example, if the test had set participant timeout of a minute, but test script execution would take 5 minutes, the test would be terminated a little bit after that minute mark had passed.
Checking that the Start interval setting is aligned with your plans
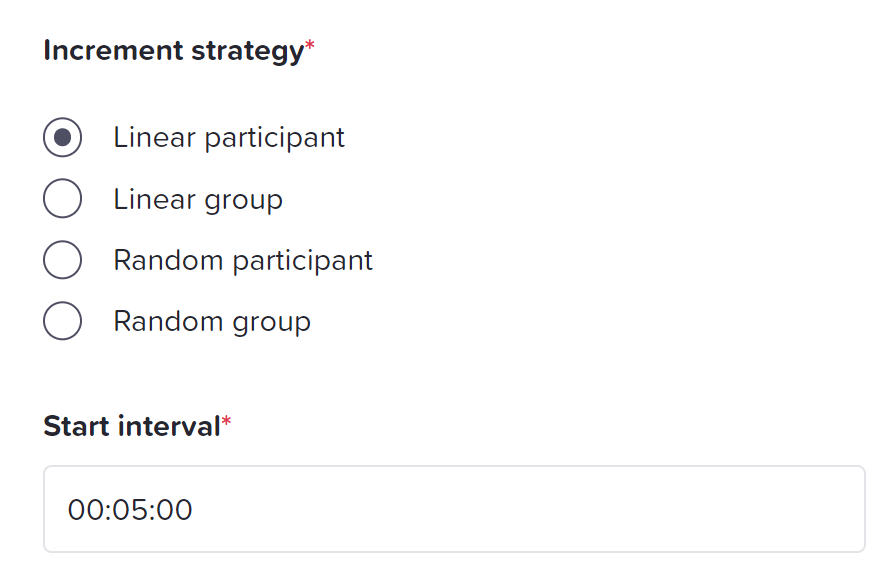
The Start interval indicates in what time frame ALL of the test participants will start their test execution, the time frame is also sometimes called ramp-up time. This parameter together with your chosen Increment strategy gives you control over how participants start the test run and what is the delay between participants joining.
For example, with a start interval of 5 minutes and linear participant increment strategy, a test with 6 participant setup will join each participant every one minute starting from zero (1st participant – 0:00, 2nd participant – 1:00, etc.). Make sure to choose the Start interval according to the planned duration of your test run. If your test script can be executed in a short period of time, having a too-long start interval may cause some participants to finish test execution before other participants have started.
Tip: You can learn more about controlling how test participants start a test run from this blog post about the load generation strategies.
Not waiting for a page/element to fully load and become interactable
Moving on, another pitfall we have observed for some of the tests is that the test script is not validating if the page/element is visible/interactable before executing actions with a specific page/element. While such validation isn’t necessary, this practice can save you a lot of time debugging if some click commands fail due to elements not loading fast enough. We always use this approach in the test scripts we create for our clients. To solve this problem, just add a simple check with maximum wait timeout which depends on each test expectation.
For example, when using JavaScript language utilizing NightwatchJS framework, you can call `.waitForElementVisible(elementLocator, maximumTimeout)` which will wait up to maximum timeout value for the element to become visible. If the timeout is reached, test execution will finish and an error will be thrown, which can be viewed in the participant Selenium log. If the page/element becomes visible before the timeout is reached, the test will continue its execution.
Not incorporating pauses within your WebRTC tests
Another common mistake done by users is not adding pauses in their test script when a participant should just remain connected within the WebRTC call room. Test run finishes for a participant in Loadero once the whole test script is executed, so if there are no more commands to execute the participant will leave the session. This leads to a quick end of test execution as all commands have been executed, but valuable WebRTC data was not collected within this short period of time, because the session was cleared when the participant exited the call.
To address this issue, once your test participant joins the room, you can add a pause command in the test script. Each language has a different function/method for accomplishing so checking language-specific documentation for this command is recommended.
Tip: If you are working on a test for a WebRTC application, you might find our free guide to WebRTC testing handy. Feel free to download it here.
Checking participant configuration
Checking if compute unit setting for test participant isn’t too low
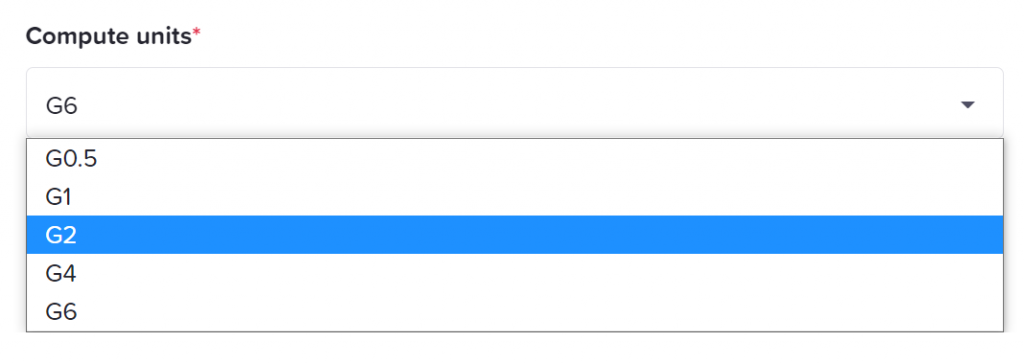
One of the most prevalent mistakes we have observed within our user tests is the setting of too low of a CU setting for individual participants. Each website requires certain computing power to function properly. Reducing CUs within the test saves money but could result in an unstable test or the website may become completely unusable. You can read more about the compute unit setting in this blog post.
These are approximate guidelines we would suggest for each corresponding CU option:
- G0.5 – Participant most likely is only testing some API endpoint with HTTP requests, could struggle with simple web application opening and navigation.
- G1 – Participant opens and traverses a simple page. This setting usually is not enough for video streaming, WebRTC related functionality, and resource-intensive application such as collaborative workplaces.
- G2 – We suggest using this CU setting at the start if you will be testing WebRTC related functionality. Should be enough to handle a small WebRTC call room with few participants in it.
- G4/G6 – Depending on the load generated on the machine from the WebRTC call G2 CU setting might be too low to handle the increased load of larger call rooms. After tests, the user should inspect the machine/WebRTC statistics of the test run and decide if the increase in CU setting is necessary.
Tip: When we are starting work on a test configuration, usually first we try running the test with G2 compute unit setting first.
Machine statistic graphs will be available while the test is running in performance mode which is limited to 50 test participants. WebRTC graphs should be available if we were able to successfully generate WebRTC connection data. Observing these graphs will give you the most insights into how the participant was handling your test script.
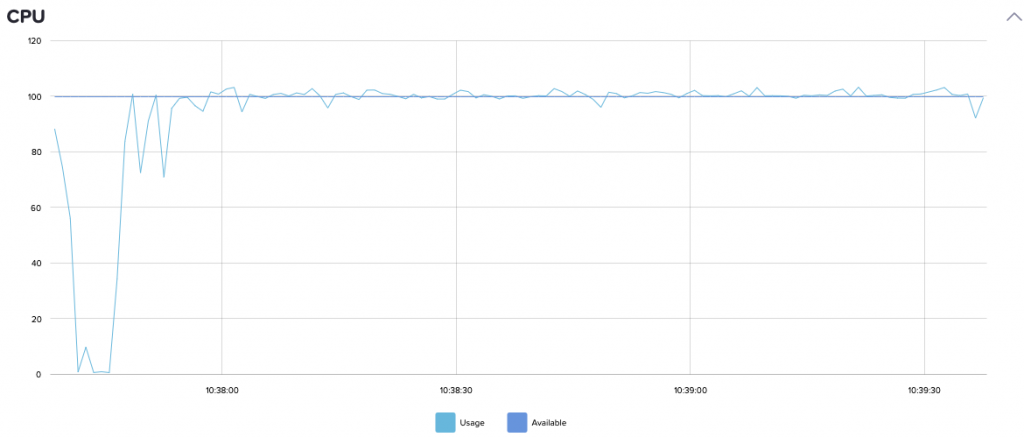
WebRTC test using G2 CU setting. Almost maxed out CPU during the whole test which can generate incorrect results as some action could have been throttled. If you have a similar CPU usage graph in your test, consider increasing the compute unit setting.
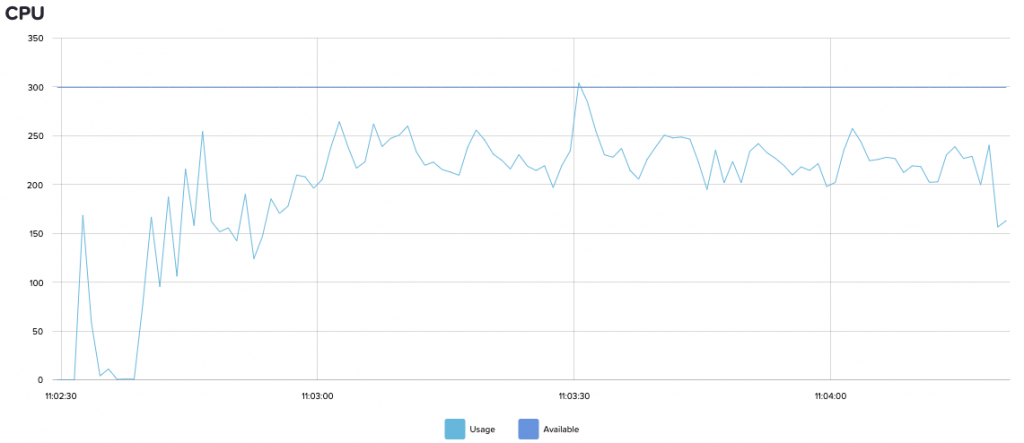
Same WebRTC test using G6 CU setting. We can see that even after increasing CU setting it was using almost all resources, which were not available for the G2 CU setting case. The high CPU usage is generated in this test because we were using a 1080p 30FPS dynamic video feed.
Important: Remember that increasing participant count joining a single WebRTC call room in most cases increases the resources your web application will be using.
There are also some cases where a page completely crashes and we are unable to retrieve all the relevant data because of it. In those cases, when observing Selenium logs for a test run, an error will be thrown stating that the page crashed. In most situations, that means that the selected participant CU setting was set too low.
Here is an example of the Selenium log for a test with a page crash:
→ Running command: url ('chrome://crash')
   Request POST  /wd/hub/session/bfe32d35e0da2592333eaf6ed4dd19ee/url
   { url: 'chrome://crash' }
   Response 200 POST /wd/hub/session/bfe32d35e0da2592333eaf6ed4dd19ee/url (257ms)
   { sessionId: 'bfe32d35e0da2592333eaf6ed4dd19ee',
     status: 13,
     value:
      { message: 'unknown error: session deleted because of page crash',
        error:
         [ 'from unknown error: cannot determine loading status',
           'from tab crashed',
           '  (Session info: chrome=98.0.4758.80)',
           '  (Driver info: chromedriver=98.0.4758.48 (d869ab3eda60629b9fabbd4e30c0f833466c83fd-refs/branch-heads/4758@{#415}),platform=Linux 5.11.0-1021-aws x86_64)' ] } }
 Error while running .navigateTo() protocol action: An unknown server-side error occurred while processing the command. – unknown error: session deleted because of page crashed
Launching a test run
Not doing small-scale test runs with the developed script before running larger scale load tests.
Rushing into doing a large test run with a lot of participants is another common mistake users quite often make. First, you should be focusing on creating a stable test script and configuration with just a few participants. Once the test setup is stable(e.g. no random participant failures, assertions are within reasonable thresholds, expected behavior of test participant is achieved), you should investigate more thoroughly already generated result reports and see if there are any optimizations (e.g. check that provided selectors match single element, every participant is using unique credentials or opening a unique URL so there are no collisions) you want to do before starting to scale up your test for load testing. Approaching test creation and execution like this in most cases will save you money on the usage of Loadero and your internal service resources. It might look like a cheaper option to run a load test with the planned number of participants right away – if the test run is successful, you will need to launch fewer test runs. In fact, it is rarely the case, make sure the test you created works correctly by running it at a small scale and checking that it is ready.
Once your test is debugged and you have verified it works correctly, scaling it up is a quick and easy task to do in Loadero, you can read about how it is done in this blog post.
Aborting a test run
Sometimes it happens that you notice an issue in the test script or configuration after you have launched a test run, for example, you notice that the test is running longer than you expected. Regardless of the scale of your test, even if you configured a high number of participants in it, it is a good idea to let the test run anyway and finish naturally.
Tip: Aborting a test run doesn’t impact your cost of Loadero use. Compute units used in a run are added to your billing once the test run has started. You can learn more about when the compute units are calculated in this blog post.
An aborted test will provide limited data in the test run results report. Since the test was stopped early, some participants may not have full results available. If you are running a test with few participants for checking and debugging it, the data in the results can help you identify issues in your test script or configuration. If that was an actual load test run that went wrong for some reason, getting all the data from such a run is still valuable, as you might get some insights about performance from it.
To sum it all up, there are many pitfalls users could encounter while working on automating their tests, but there are a lot of different points that can and should be addressed right away during the development of properly working tests using Loadero or any other tool. As there are many different elements simultaneously working together and affecting results, the test creation process should be done very carefully to avoid unnecessary expenses.
I hope this article will help you with your test development and execution and I hope to see you in our next one. If you have any questions about using Loadero, feel free to use the live support chat we have in the app to get your questions responded to.


