

In any kind of test, it is crucial to understand how your test performed – see the passing rate, detailed statistics of various metrics and sometimes even logs. In different cases you may be interested in different web application performance metrics. We take results reports seriously and Loadero has very useful features for viewing and analyzing test results. Sometimes you need to see only some basic information such as success rate, but other times you need to see all the details. In Loadero test run reports you can see general results in an overall result summary or dive deep into details. Inspect each individual participant assert, investigating different logs, downloading various artifacts and even exploring WebRTC statistics graphs. Sounds great? It sure does so let’s look at how you can get the maximum from your test results!
Having a comprehensible report is crucial to present data in an attractive way, for example to the stakeholders or your colleagues, who do not take part in testing activities, but are interested in results. It does not matter if you are running a performance test to see how well a machine is running your website, a load test to understand how your application is running under the desired load or just debugging your test script using our nifty session recording mode. You may have set your web application performance metrics in advance with asserts, or create assert preconditions after reviewing a report to check for some new factors. We got you covered regardless of your chosen test settings.
Prerequisites:
- Active Loadero account (you can create one here, it’s free).
- Logged in Loadero.com with your active account.
- A project with a test that has all of the necessary structure and participants created for a test run.
Result view
The test results can be accessed by choosing a project of your choice and clicking “Results” on the left sidebar and then “View results” button on the finished test. The opened view is helpful to check overall results if you don’t need to go in detail.
There you will find multiple tabs in the following order:
- Summary
- Participants
- Asserts (only available for performance tests)
- View script
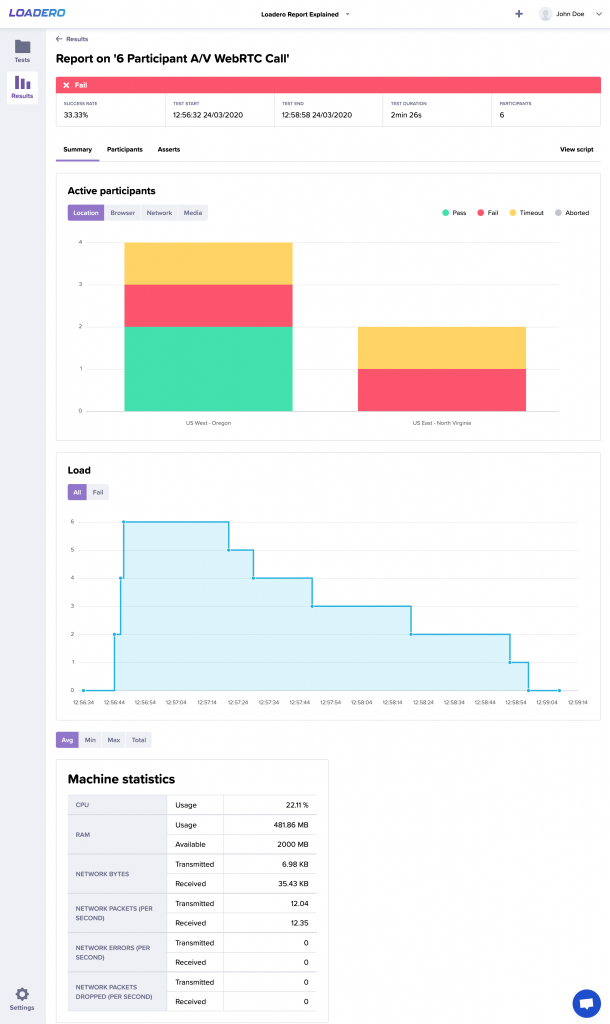
Summary
This view has brief information about your test run. You can see participants’ success rate and filter by location, browser, network and media type in the “Active participants” graph.
In the “Load” graph view, you can see the time and number of participants who started executing your script. This comes in handy when running load tests, for example, to see at which moment you get an error. Last but not least you can see overall machine statistics for your test run such as total transmitted and received network bytes, average CPU usage and many more. All this data helps to understand the overall efficiency of your application.
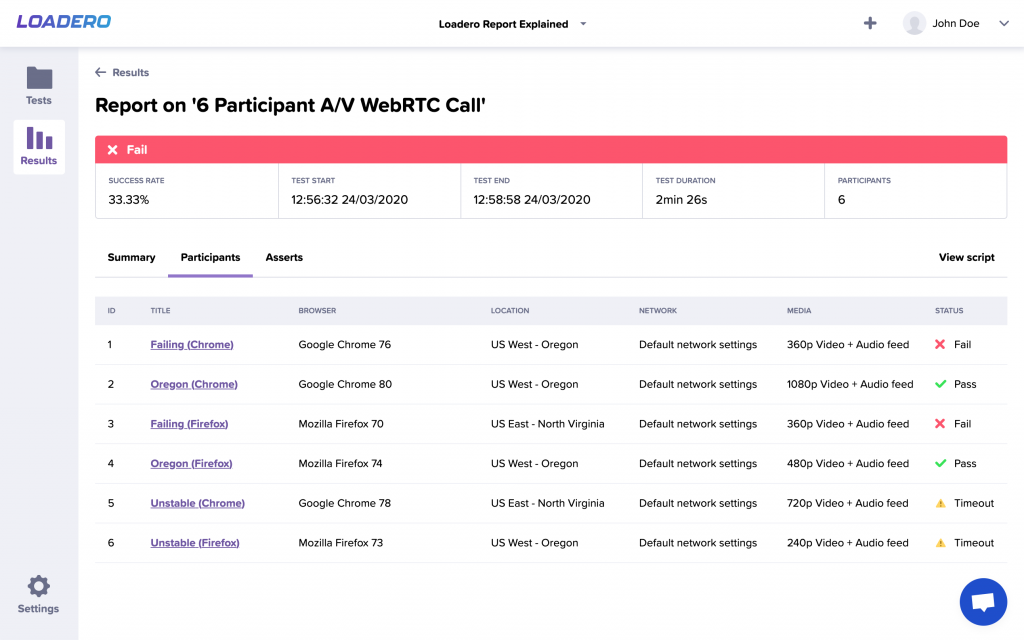
Participants
In the participants tab, we have summarized each individual participant’s main details, i.e., its title (with the group title in the parentheses), browser and its version, location, network conditions, media type, and success status. The status allows you to quickly validate each participant:
- Pass – the script was executed successfully and all assertions were passed.
- Fail – either the script or at least one assertion failed.
- Timeout – the participant was executing the script longer than provided participant timeout.
By clicking on the participant title, you get more detailed information about the selected participant, we will take a look at that a bit later.
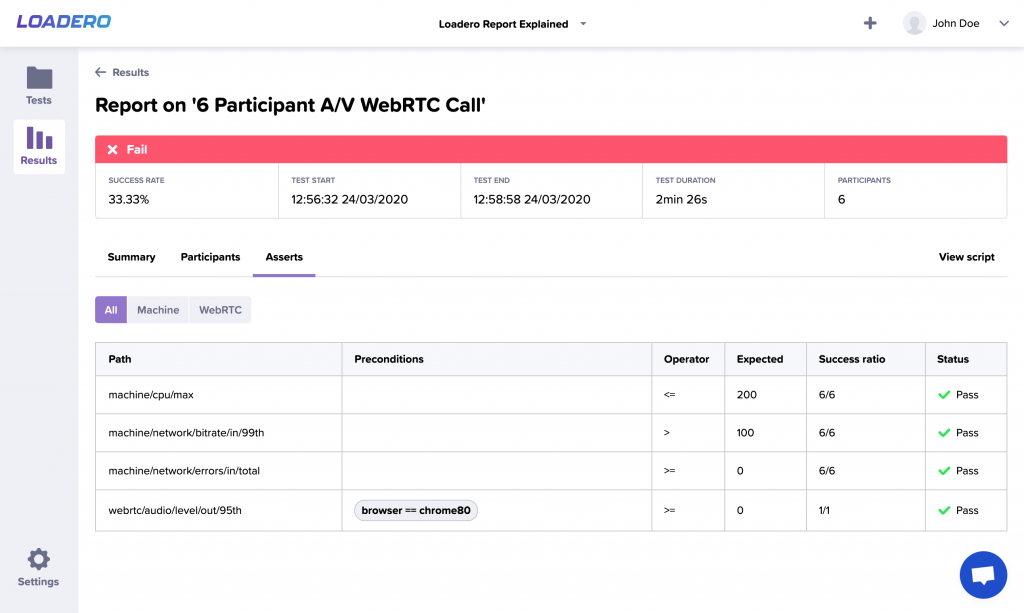
Asserts
In this tab, you can see the overall results of the asserts and their preconditions and total success ratio for the assert. To learn how to use post-run assertions to their maximum, we recommend reading our blog article about them.
View script
Simple read-only script view in case you need to check if your test executed correctly. This will come in handy if the script changes over time or you want to verify some specific steps.
Individual participant
Quite often there is a need to view individual participant metrics, especially if the participant failed and you need to puzzle out why it failed. In this and many other cases, you will find individual participant view very useful. Having access to detailed information about your test runs is important and can increase the effectiveness of your testing efforts dramatically, that is why we are proud to say that Loadero provides you this option.
In this view, there are multiple tabs and with some of them you are already familiar from the result view:
- Summary
- Asserts (only available for performance tests)
- Logs
- Artifacts
- WebRTC statistics (only available for performance tests)
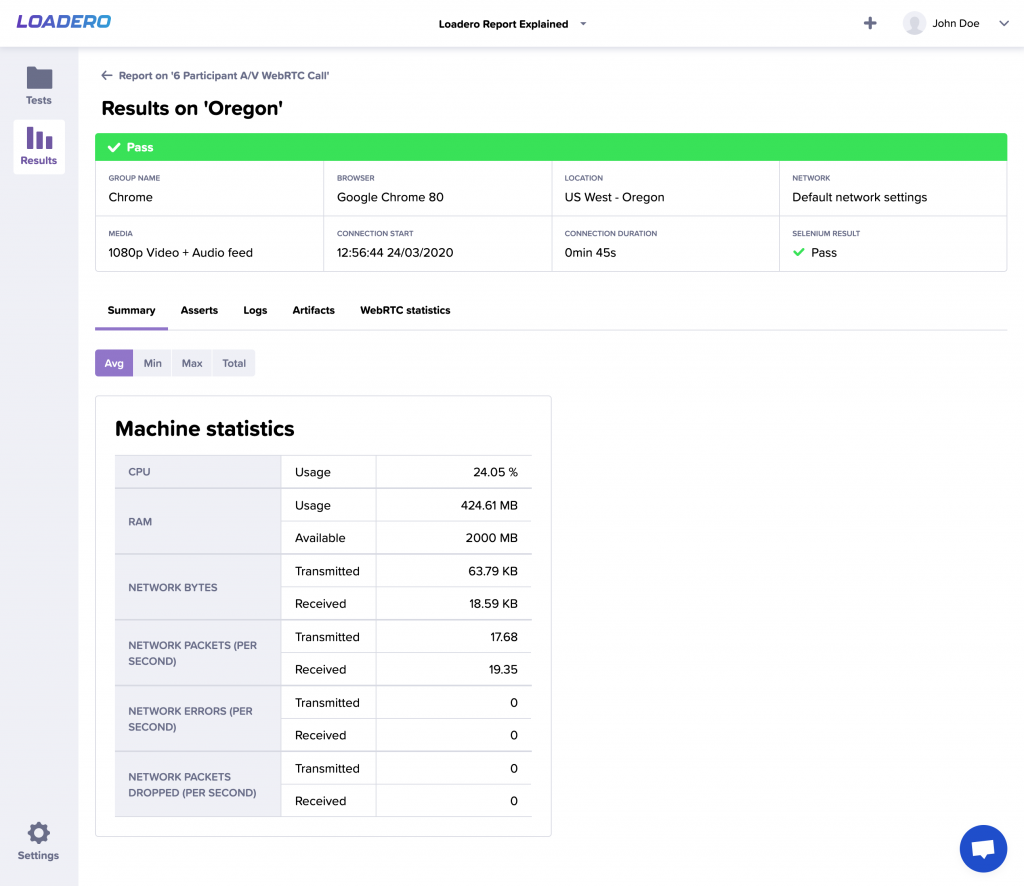
Summary
Similarly to the result summary view, here you can see machine statistics, though for the individual participant you can see the individual machine’s data.
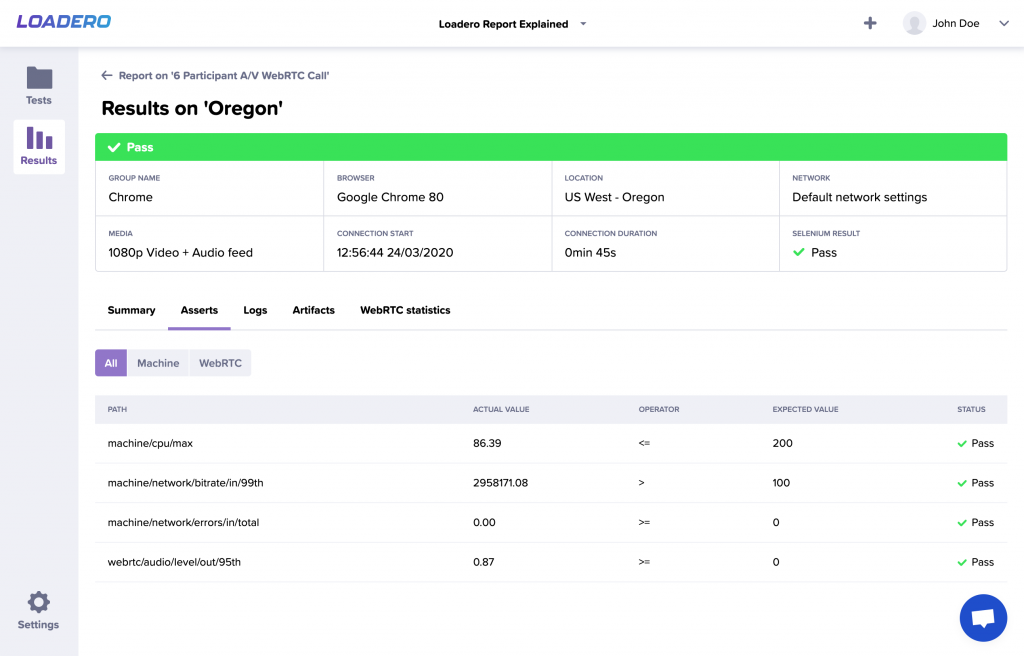
Asserts (performance test only)
Enables you to see each assert’s actual value and its status (pass, fail or skipped), as well as to filter them by their data source.
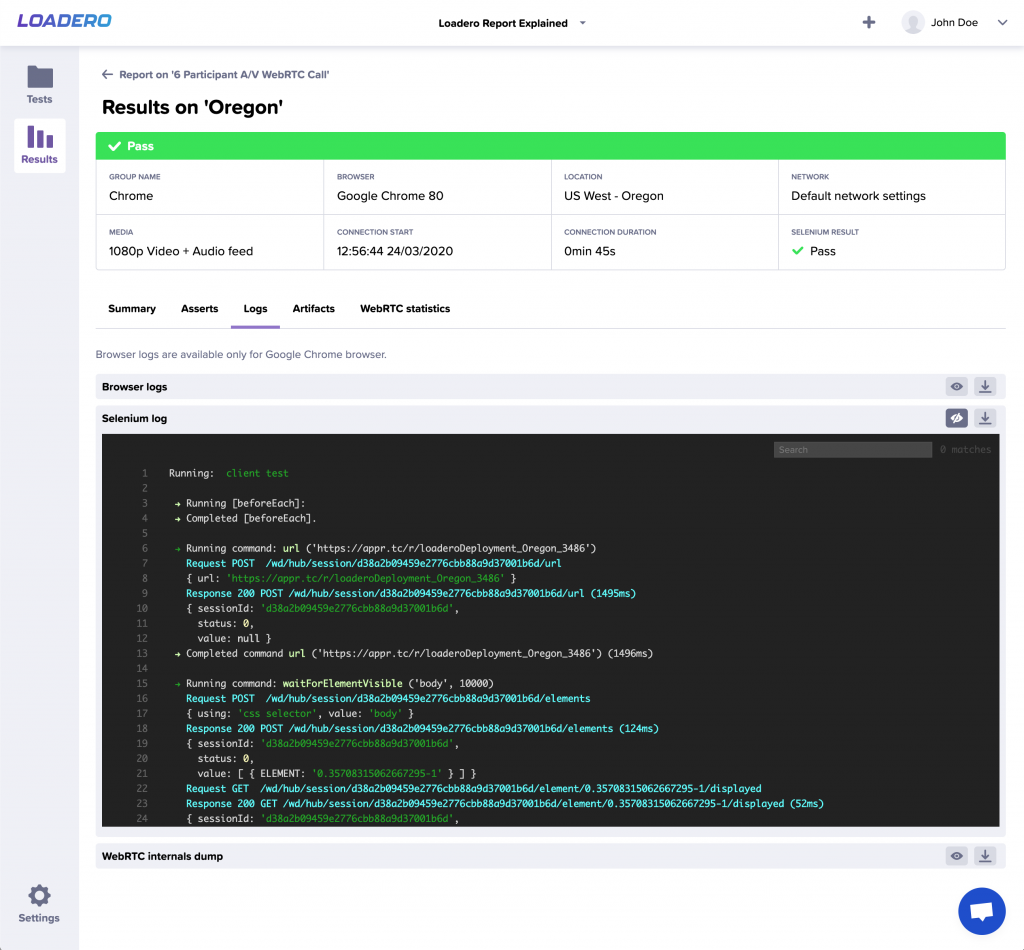
Logs
Loadero offers three types of logs for downloading or viewing online: browser and Selenium logs, as well as WebRTC internals dump. Remember that browser logs are available for Google Chrome browser only. Logs allow you to understand each participant’s behavior as well as potential issues with the script you provided. To learn more about which logs are available to which test mode, visit our wiki page.
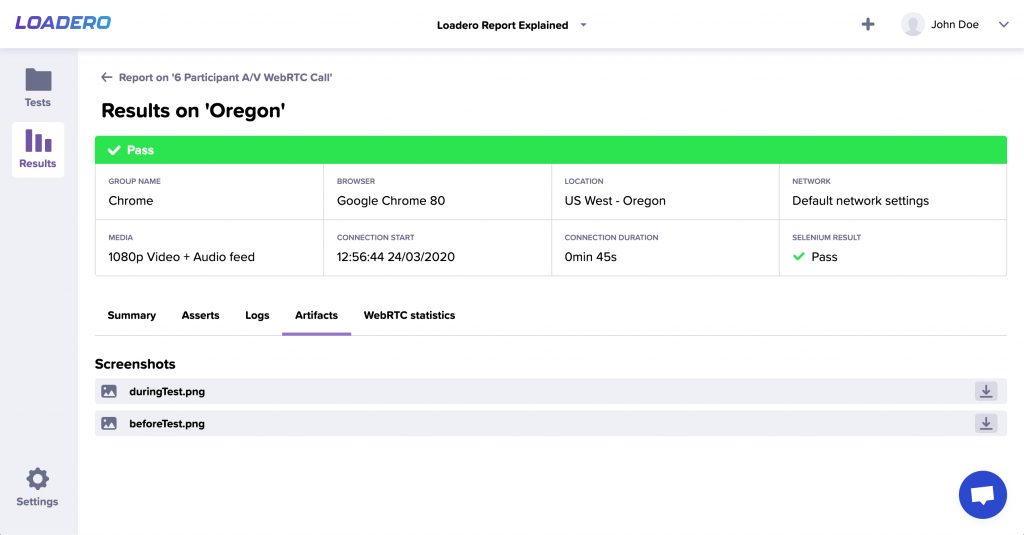
Artifacts
In this tab, you can download artifacts that were generated by the participant such as session recording (produced only if the test was running in session record test mode), screenshots and downloads. This feature helps you to debug your script and even test whether your application’s file download works properly.
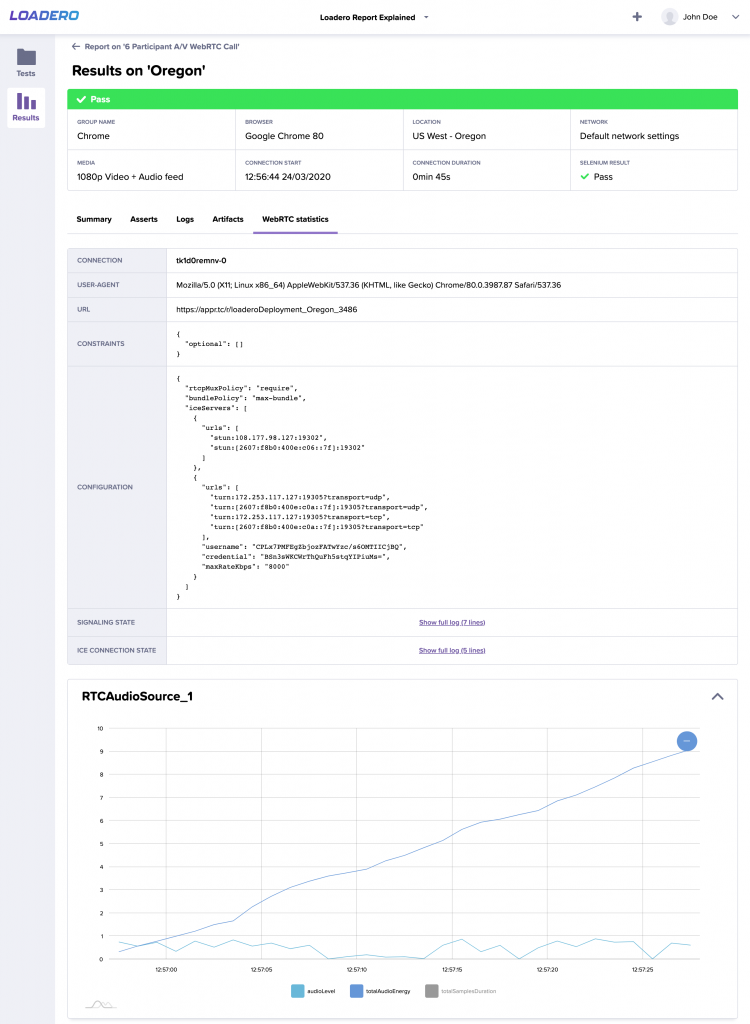
WebRTC statistics (Google Chrome only)
Truly insightful feature for analyzing WebRTC internals dump file instead of manually going through all the data. You can zoom in by selecting a portion of the graph or you can filter by selecting/deselecting specific category at the bottom of the graph.
As you can see, results are one of the killer features of Loadero – it provides detailed statistics, graphs, artifact collection, and even individual participant’s machine data. All this data presented in a neat way, allows you to present it directly to the stakeholders, clients or colleagues to understand how your application is performing. Running correct tests is a critical part of making a great service, but getting access to detailed results of your web application performance metrics is not less important. Sign up for a trial, run a test and get access to all the great features for exploring the results reports for free. To learn more about results, check out our wiki page and if you need any help with your tests, don’t hesitate to contact us at support@loadero.com.