

Intentions
The main goal of the research was to study and analyse the performance of WebRTC solutions provided by various CPaaS (Communications Platform as a Service) vendors. To help our customers that use Loadero to test the WebRTC performance of their web apps, we found it useful to be aware of what to expect from different vendors, what the rest of the industry offers and which CPaaS solution would best fit their needs. For this analysis we chose 100ms CPaaS platform and tested it against various competitors such as Daily, Dyte, SignalWire, EnableX (form. vCloudx), LifeSize and Jitsi.
Description of testing approach
To test services offered by 100ms and other CPaaS vendors, we used the following test scenarios for online calls, as we found them being common in the real world:
- Different number of participants in a call – to assess the performance of apps under different loads. We have chosen groups of 2, 4, 8 and 16 participants to simulate small to medium sized group calls.
- Limited network conditions – to assess the capabilities of apps to handle situations with non-ideal internet connection. It consists of 3 parts – no packet loss period, packet loss applied, another period without packet loss. Here we examine the performance under 5% packet loss that lasts two minutes and the ability of apps to recover from 10 seconds of 100% packet loss. Both cases were tested with 2 and 4 participants in a call, where only one of the participants had the limitation.
- Multiple region tests – to see how the performance of a call is affected by the location. Each call had only 2 participants in it.
During the test execution Loadero gathers a large amount of different WebRTC and machine metrics. We have chosen the following metrics for analysis as from our experience we know that they are representative of the performance and can indicate common potential issues.
- Machine metrics:
- Used CPU
- Used RAM
- WebRTC
- Audio:
- Incoming & outgoing bitrate
- Incoming jitter
- RTT (round-trip time)
- Video:
- Incoming & outgoing bitrate
- Incoming jitter
- outgoing FPS (frames per second)
- RTT (round-trip time)
- Audio:
Participant configuration:
- Compute units: G6 (3 CPU cores and 6GB of RAM)
- Browser: Google Chrome 108
- Location: Oregon / Mumbai / Frankfurt (depending on the test)
- Audio feed: 128kbps audio feed
- Video feed: 720 @ 30FPS dynamic video
Results
CPU
100% CPU means one fully used CPU core. In our configuration, we have 3 cores available to a participant, so 300% is available in total. But usage can go beyond that because CPU usage doesn’t have a hard ceiling, but is capped after the fact. If usage goes beyond 300% at any moment for a given 0.1 second, it is capped for the remaining time in the 0.1 seconds period.
Overview:
- Average CPU usage is higher than the competition
- Occasional bursts of high CPU usage (up to 3x the norm)
- CPU doesn’t show stable performance and may vary by up to 90%
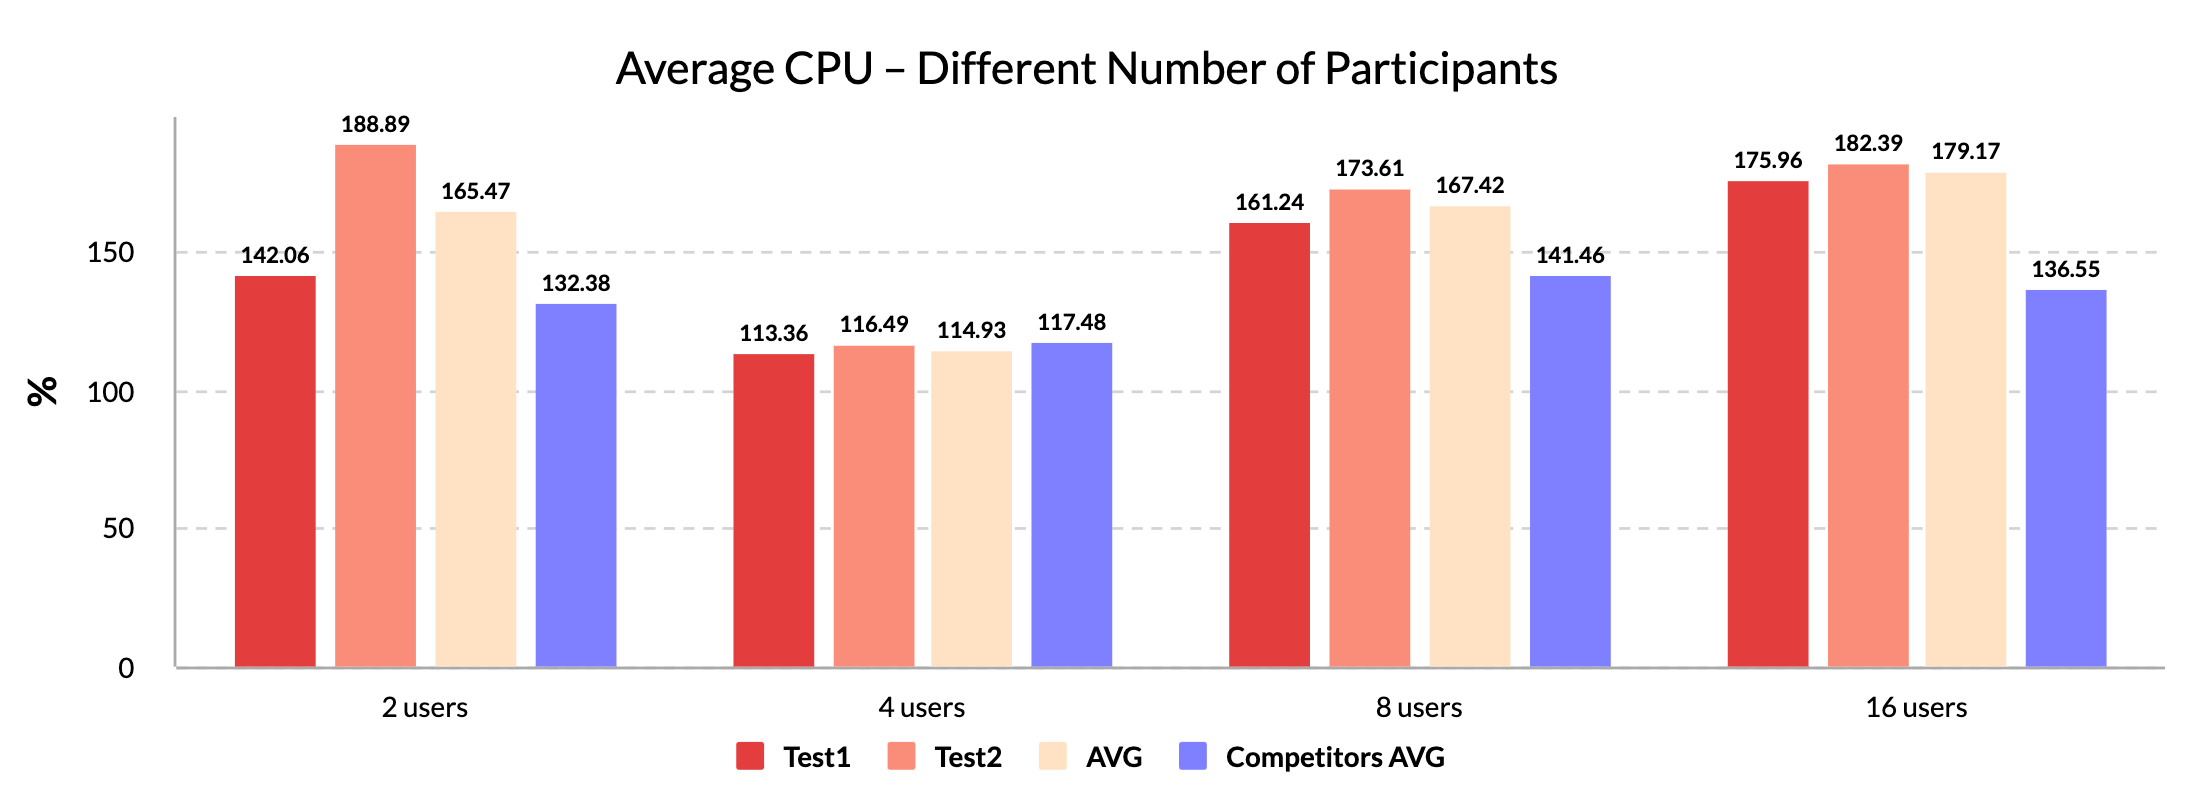
In the scenario with different number of participants, average CPU usage in 100ms app went beyond 180% regardless of the amount of users, but it averages at around 170% and is on average ~30% higher than for the rest of tested apps. While tests with higher CPU usage don’t indicate any trend, the lower boundary increases as the number of users rises.
An exception is 4-user tests, where CPU usage is by ~43% less than the 2-user tests and averages at 115%.
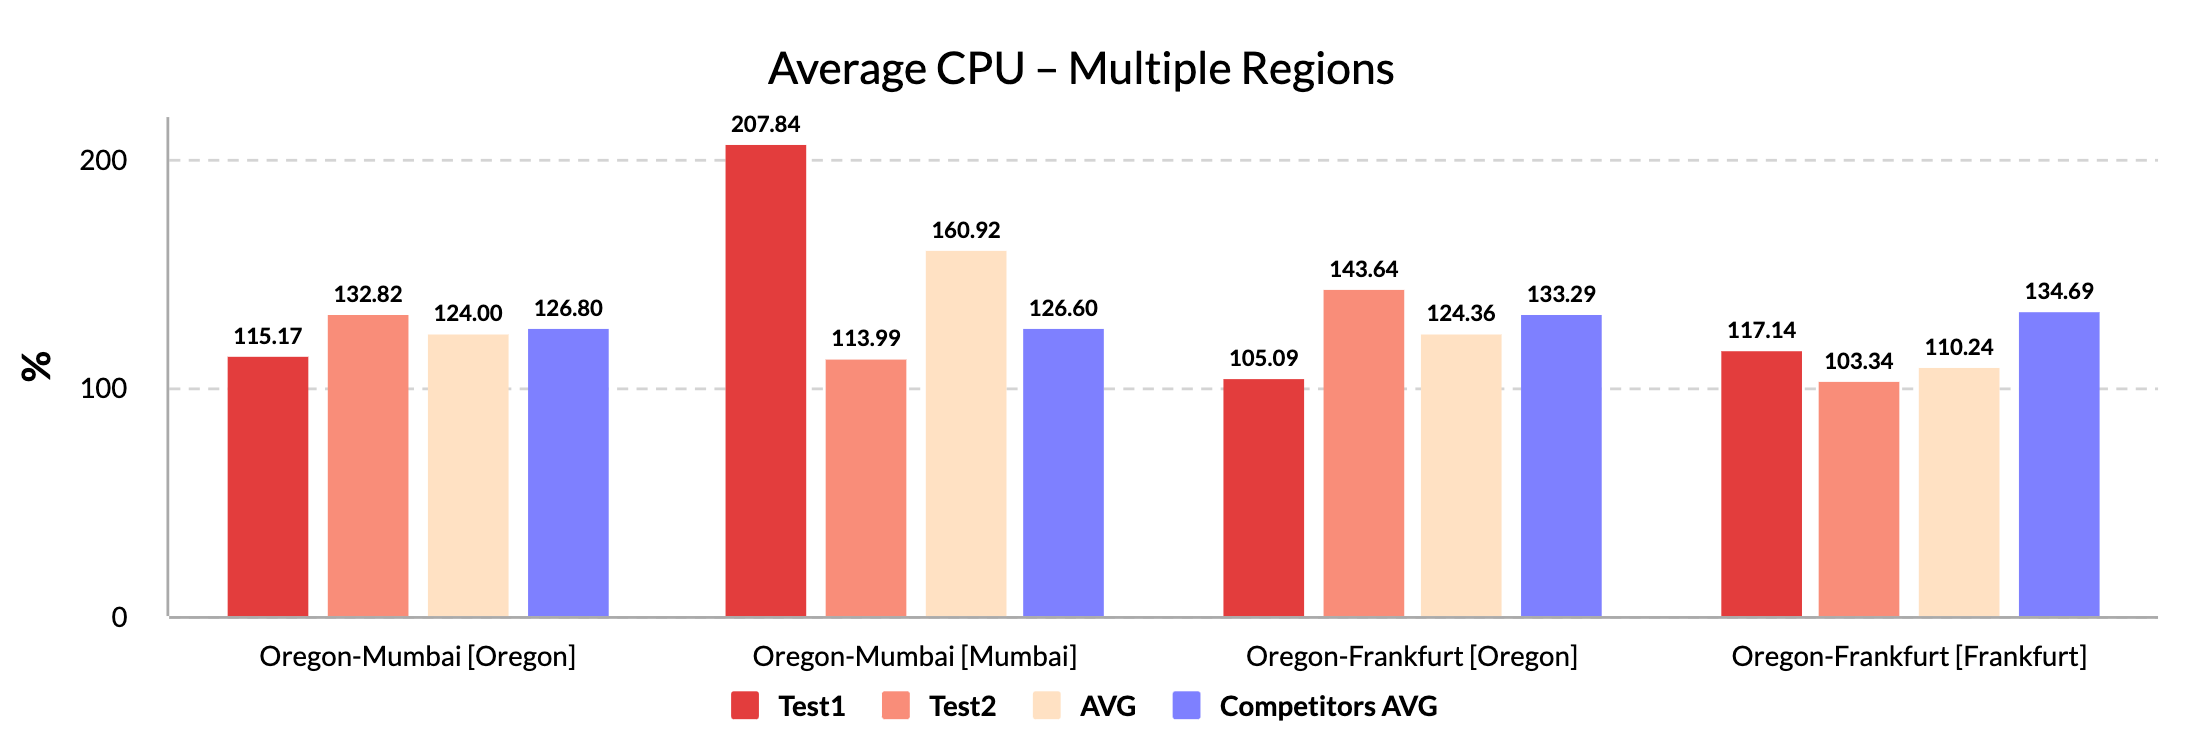
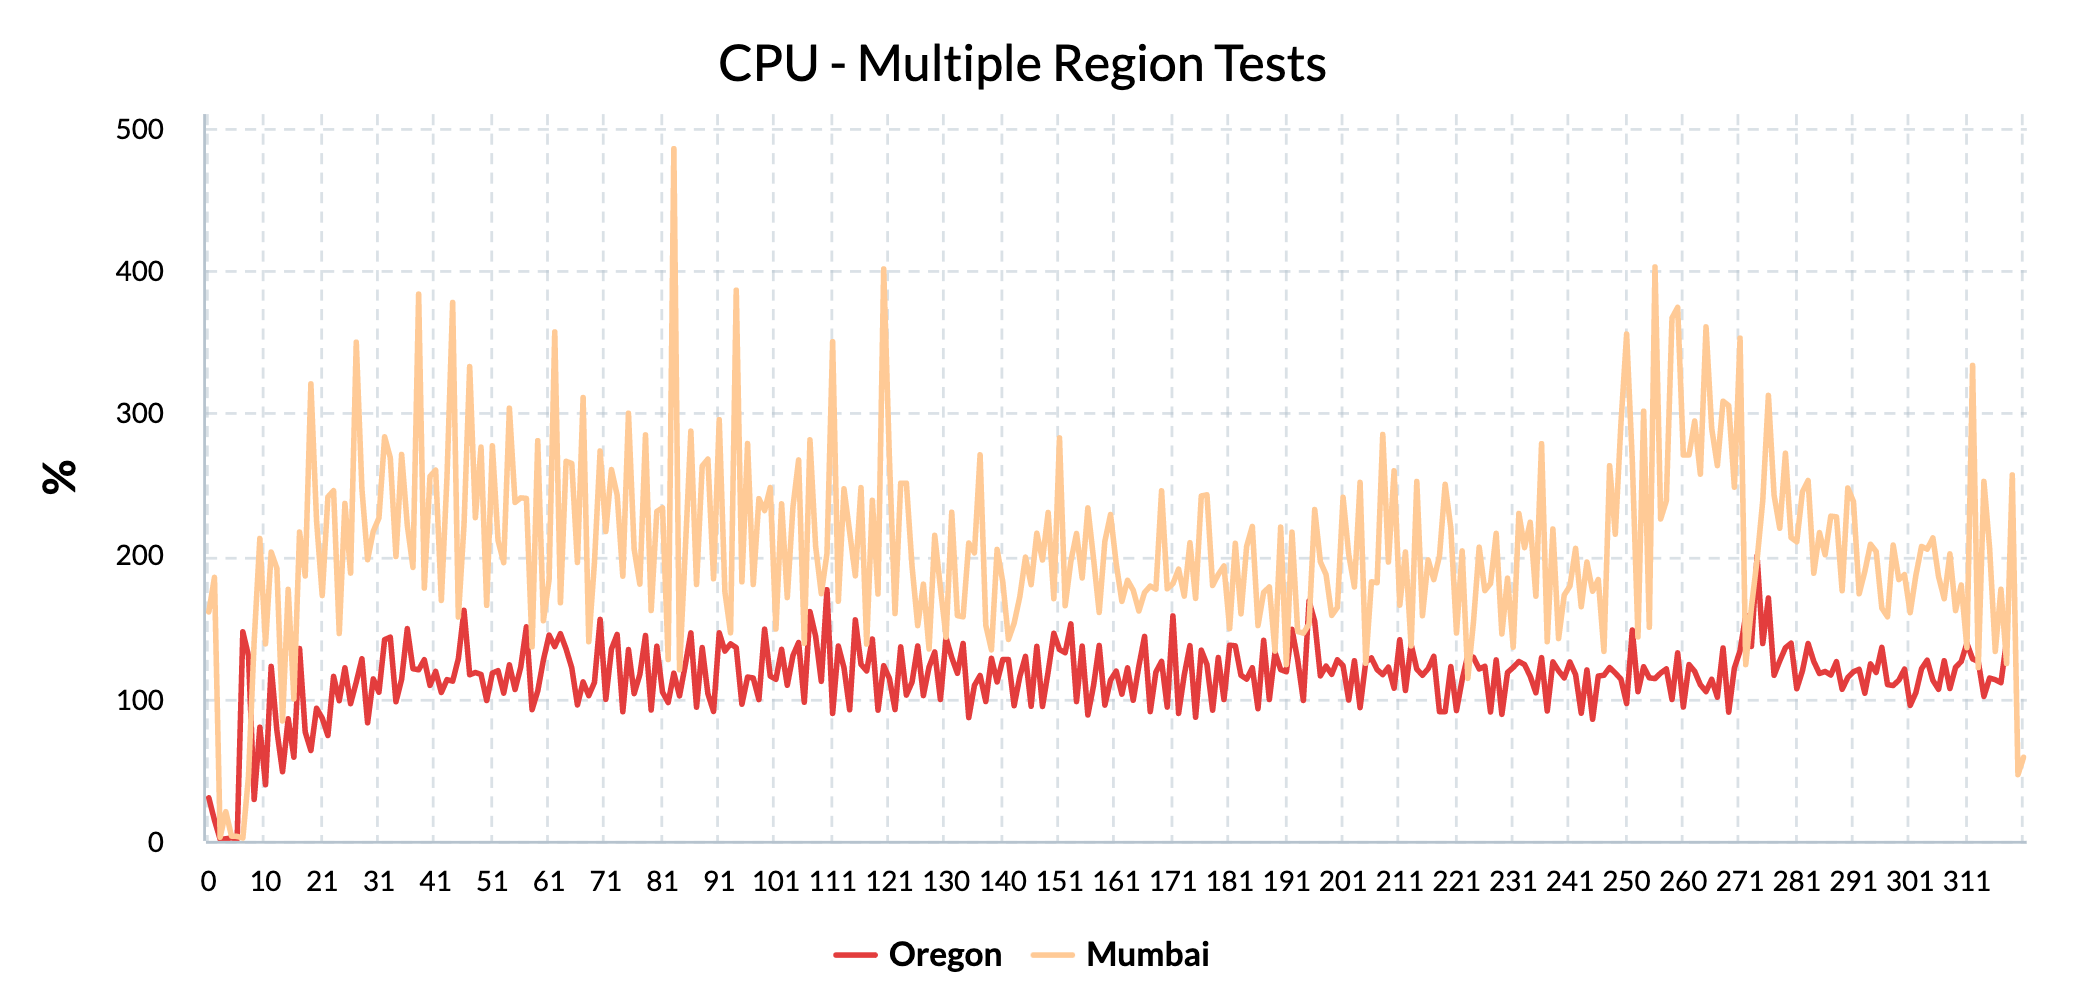
Multiple region tests don’t show stable CPU performance either. While in comparison to previous tests most of the participants have low CPU usage, around 115 – 120%, there were tests with unusually high resource consumption and spikes up to 485%.
Participants from Frankfurt were performing the best – with 110% on average and outperforming competitors by 24%.
RAM
Overview:
- Stable RAM consumption across most of the tests
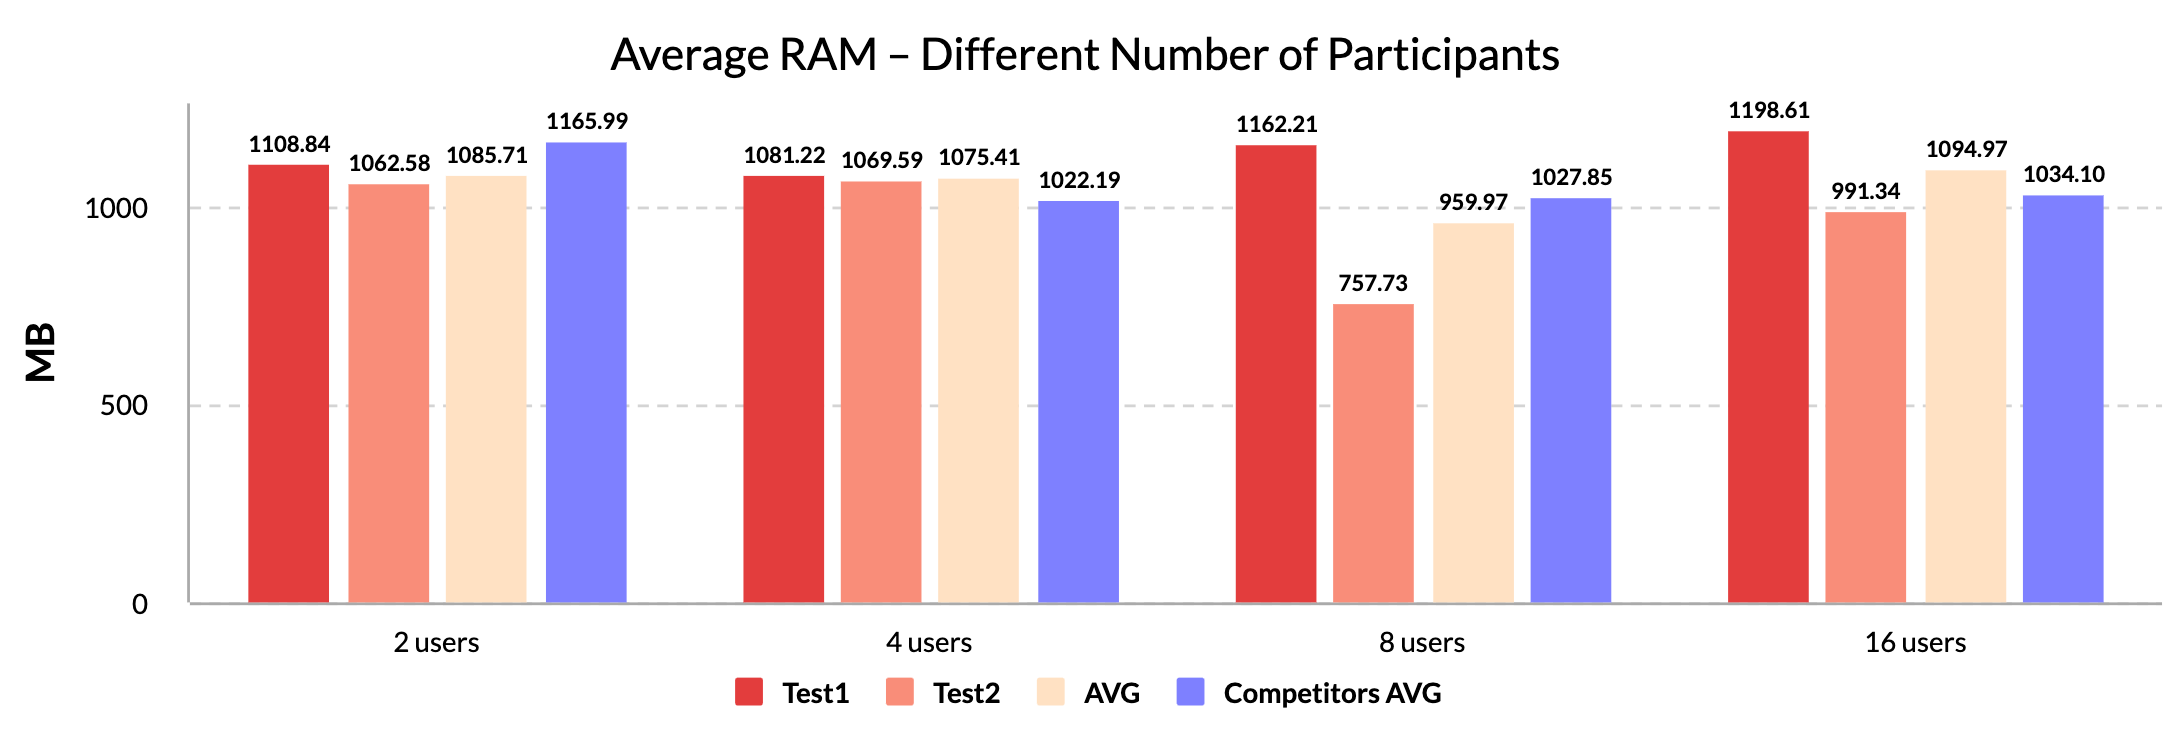
The test results don’t indicate that there is a correlation between the amount of users in a call and RAM utilized. Majority of participants had stable RAM consumption that averaged at around 1080 MB, though 8 and 16 participant tests had users with noticeably lower consumption – by 10% and 35%.
Multiple region tests were the most stable for RAM performance. Without any major fluctuations in the consumption, it averages at 1085 MB, which is by 6.4% lower than the average for competitors.
Audio bitrate
Overview:
- Consistent results across most of the tests
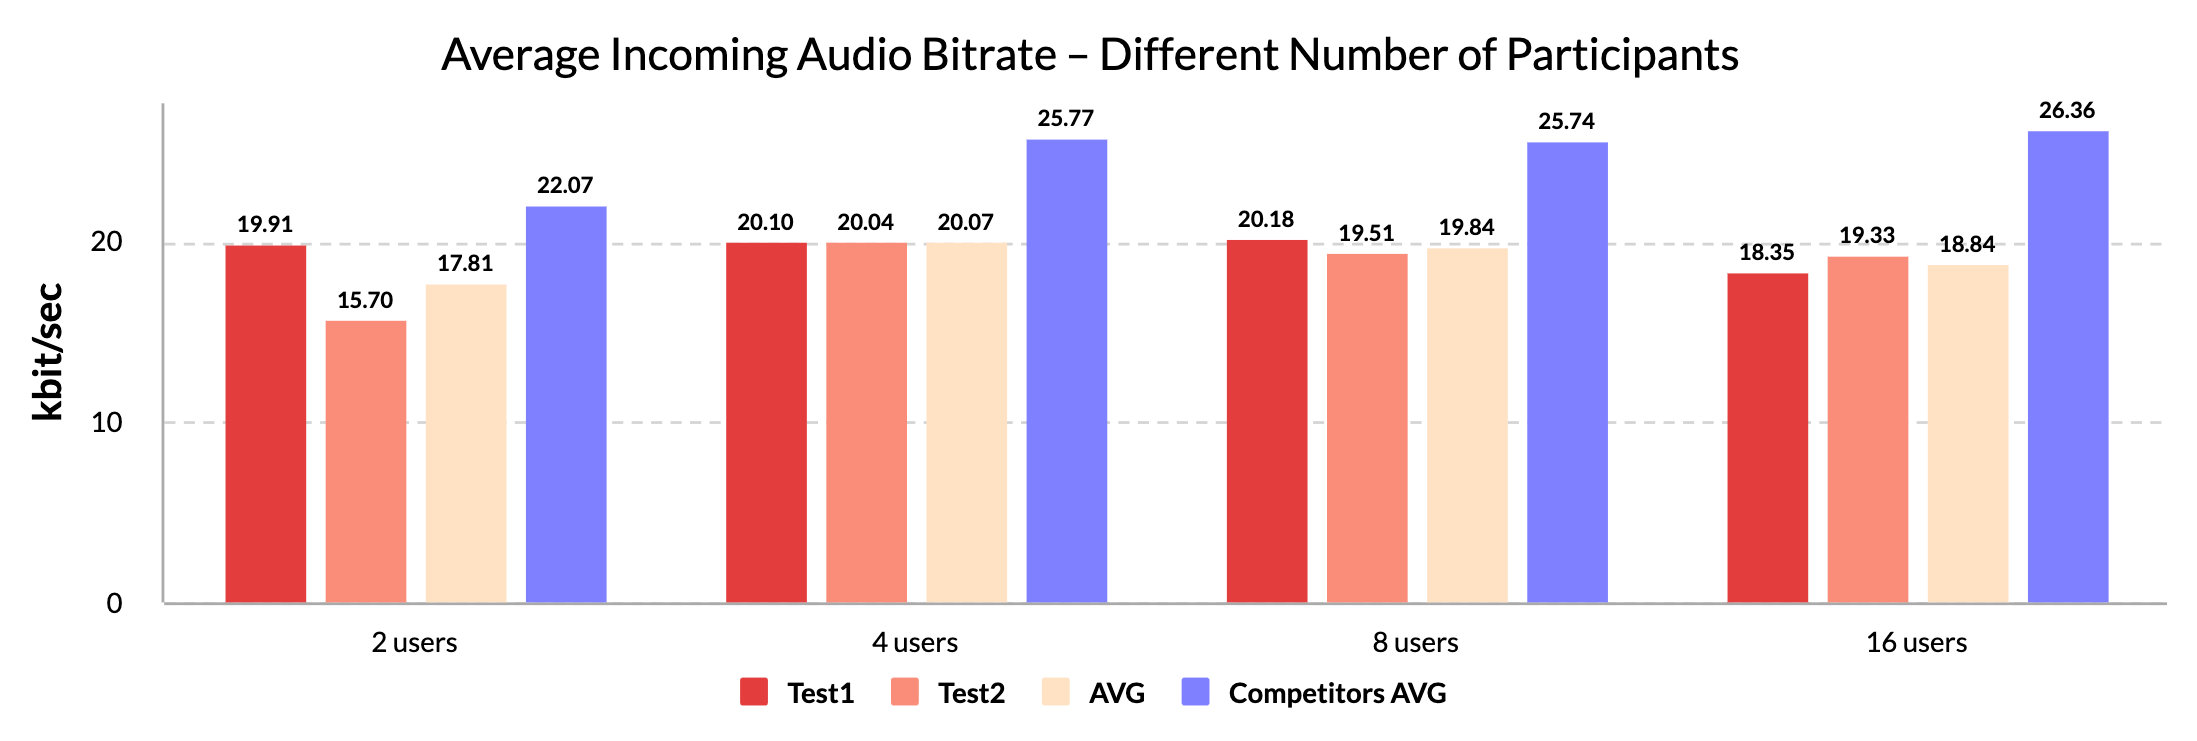
For 100ms, both incoming and outgoing audio bitrate look identical in nearly all test cases – it fluctuates between 0 and 30 kbit/sec and averages at ~19 kbit/sec, which is by 15% – 25% lower than for the competitors. The fluctuations were caused by our choice of audio. It had short periods of audio signal followed by short periods of silence.
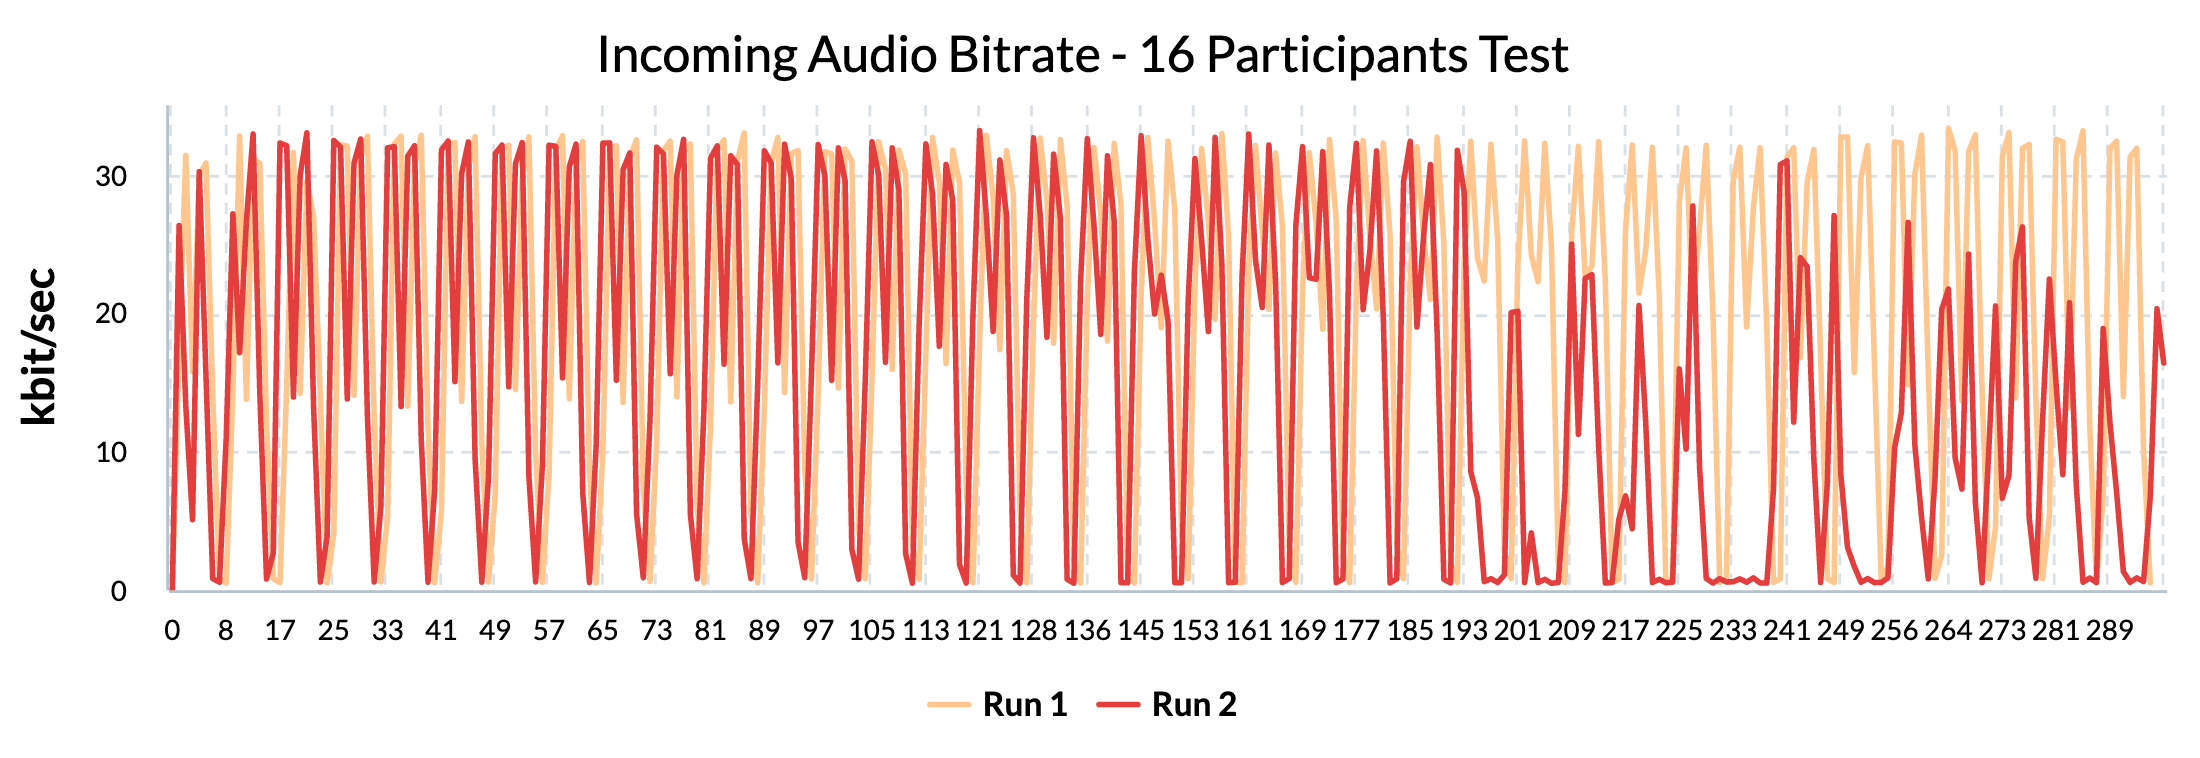
The only exception is the 16-user test, where at around the 200 seconds mark the incoming audio bitrate has fallen significantly and averages at 8.8 kbit/sec.
Audio incoming jitter
Overview:
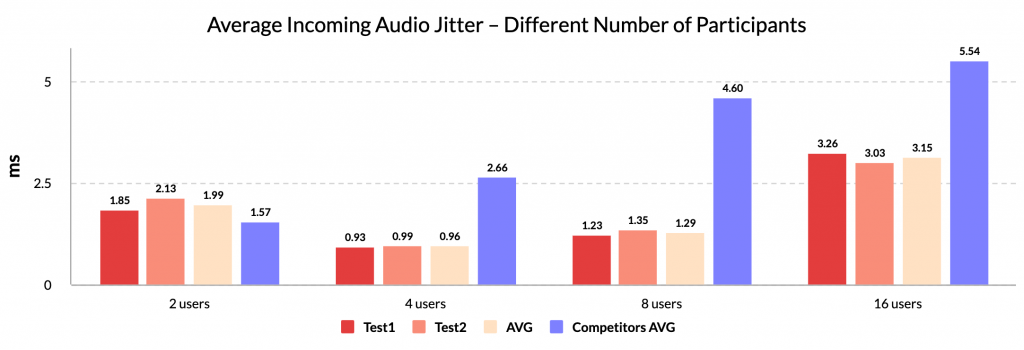
- Outperforms competitors in tests with more than 2 participants
- Jitter isn’t stable across the tests and occasionally has significant spikes
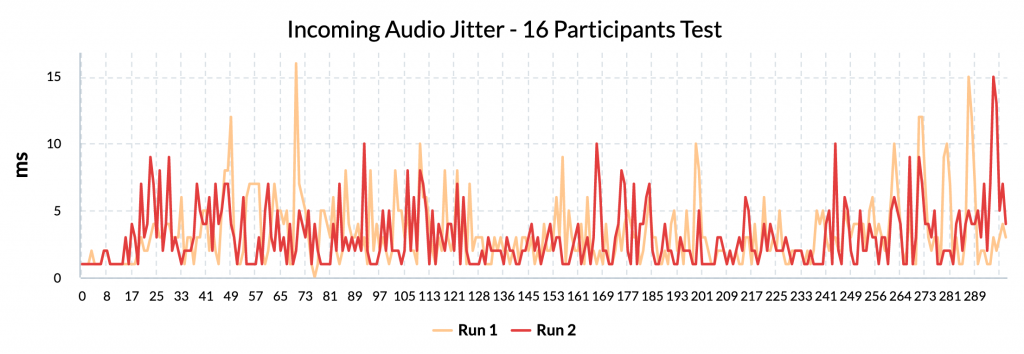
For the audio jitter half of the tests were calm with values not exceeding 4 ms and averaging at 1-1.5 ms, while the other half of the tests had noticeable instability with the worst case scenario being a 16 participants test with spikes up to 15 ms.
These distinctive fluctuations were consistent during 2-participant packet loss tests but inconsistent in other scenarios.
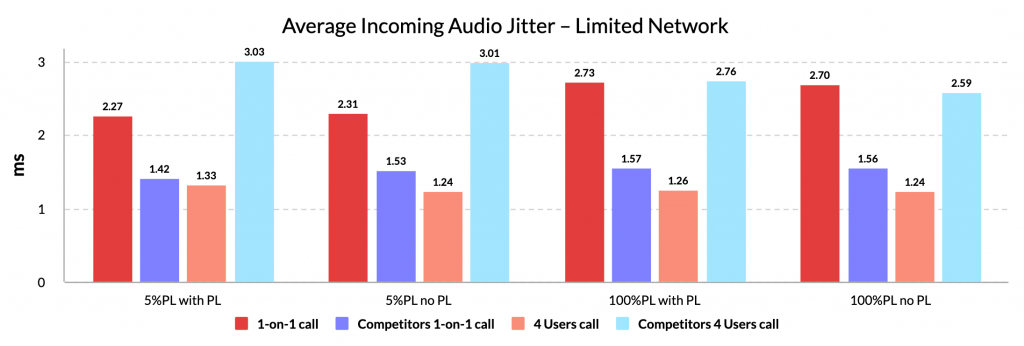
For competitors, tests with different numbers of participants show a positive correlation between the amount of users and jitter, but there isn’t any clear indication that this is the case for 100ms.
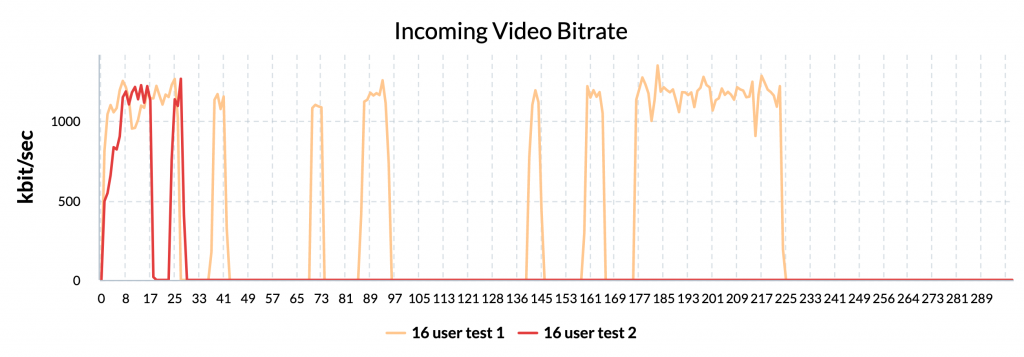
Video incoming bitrate
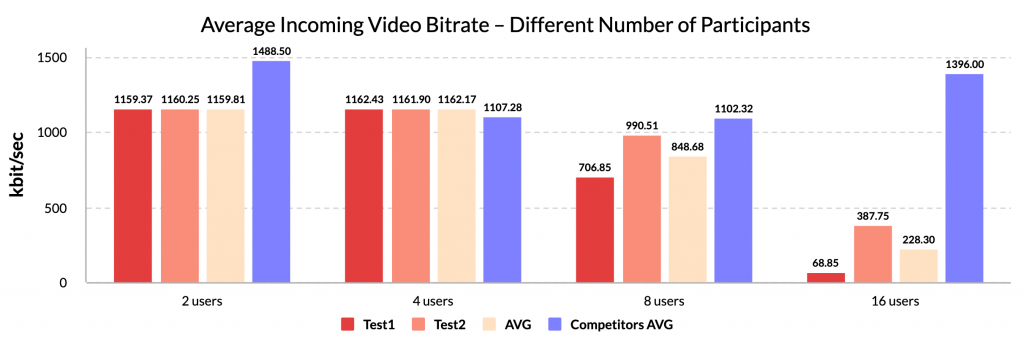
Overview:
- Long recovery from packet loss
- Video feed not being received
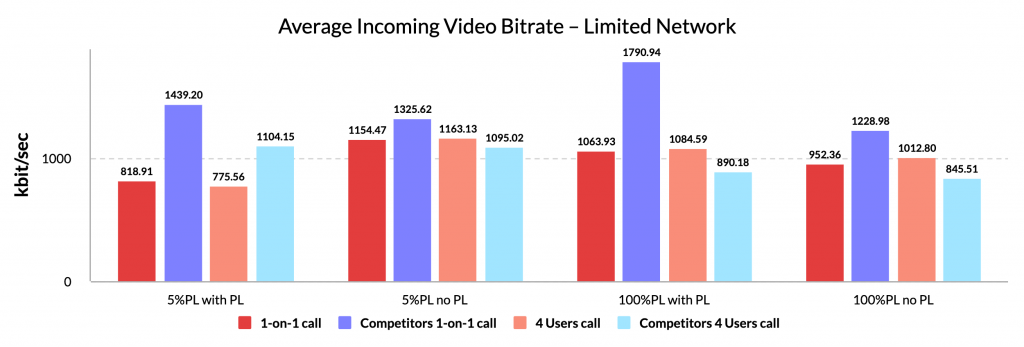
1160 kbit/sec is the average incoming video bitrate among tests with stable data – multiple regions tests, 2-participant tests, and 4-participant testss. It is by 28% lower than for the competitors, who average at ~1490 kbit/sec in the same tests.
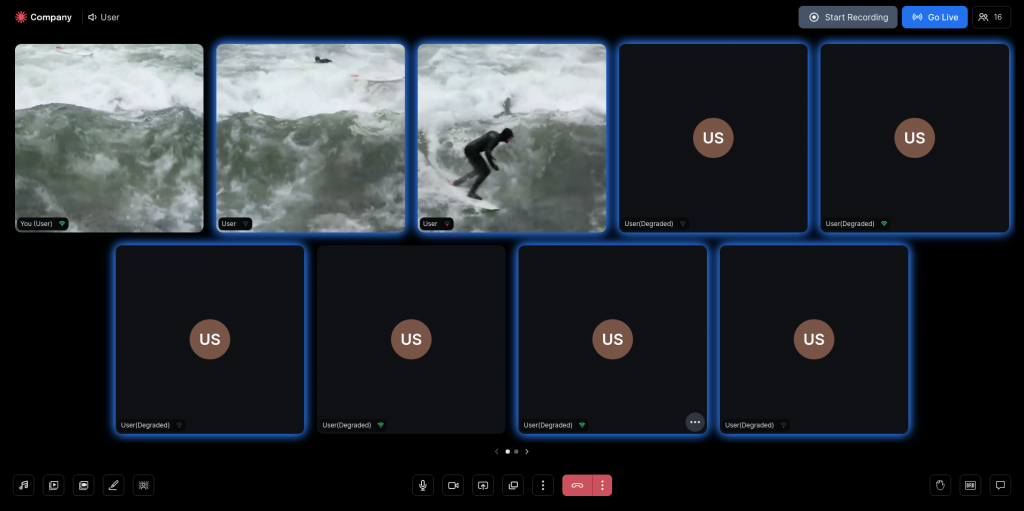
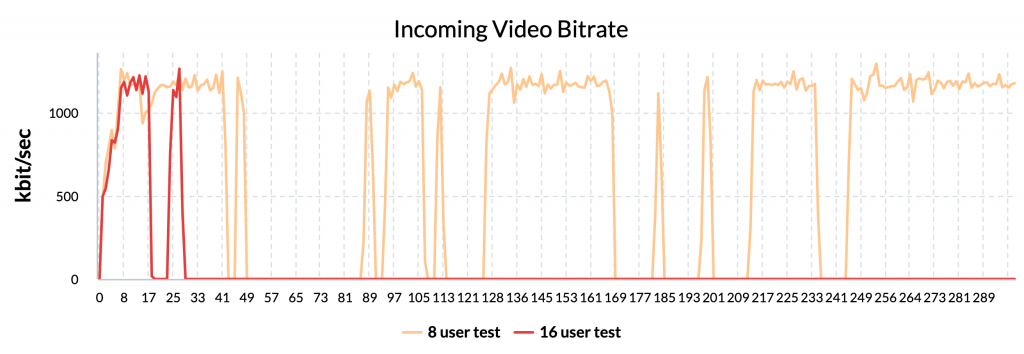
The bitrate is unstable in 8 and 16 participants tests, where bitrate drops to 0 and recovers at an uneven frequency, although for one of the participants during the 16-participant test it has completely stopped coming in after 30 seconds. We are not entirely sure what causes this but we have a theory that it could be due to the participant video not being shown during the call because there are more dominant attendees. Another explanation could be that 100ms couldn’t handle such a high number of concurrent participants in the call.
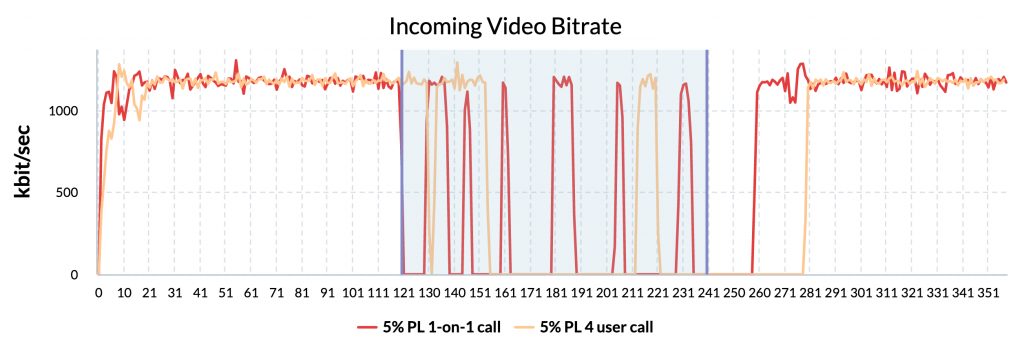
During the time period of 5% packet loss in 1-on-1 calls incoming video bitrate for competitors is by 70% higher, 1439 and 1791 kbit/sec respectively, which isn’t the case for the rest of the tests.
Also during most of these tests the bitrate drops to 0 and recovers back many times until the network resets back to default. This isn’t the case for the 4-participant call though, where data shows almost no bitrate recovery. Moreover, for one of the participants incoming bitrate didn’t recover for an extra half a minute.
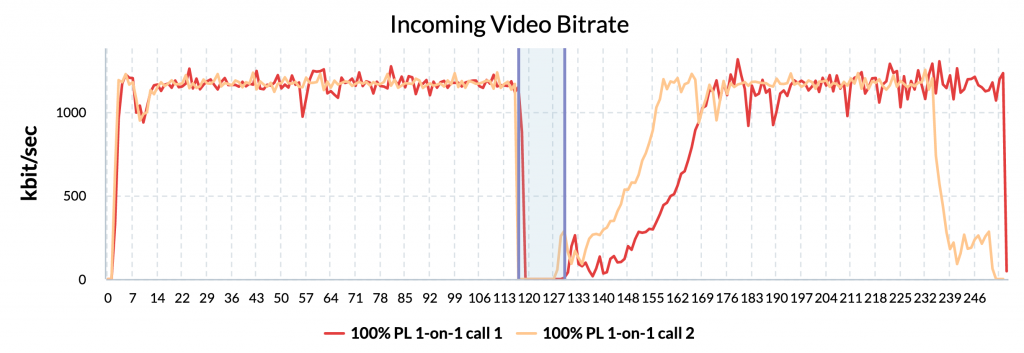
Incoming bitrate gets back to the norm from 100% packet loss only after 30-40 seconds for users that didn’t have the limitation.
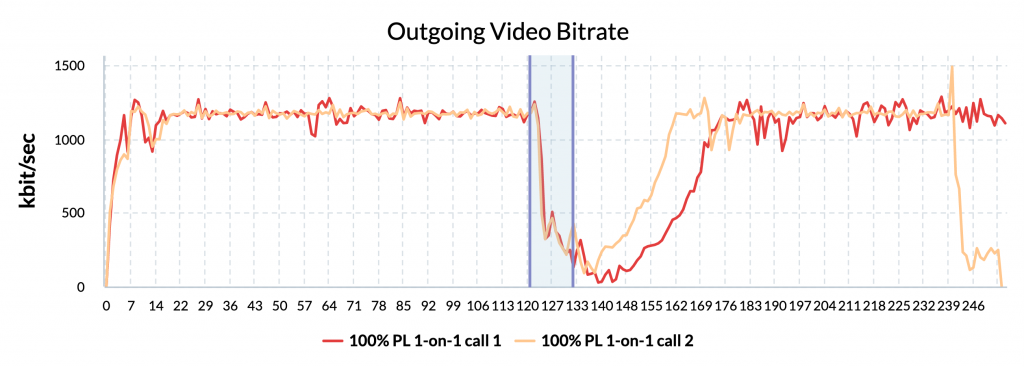
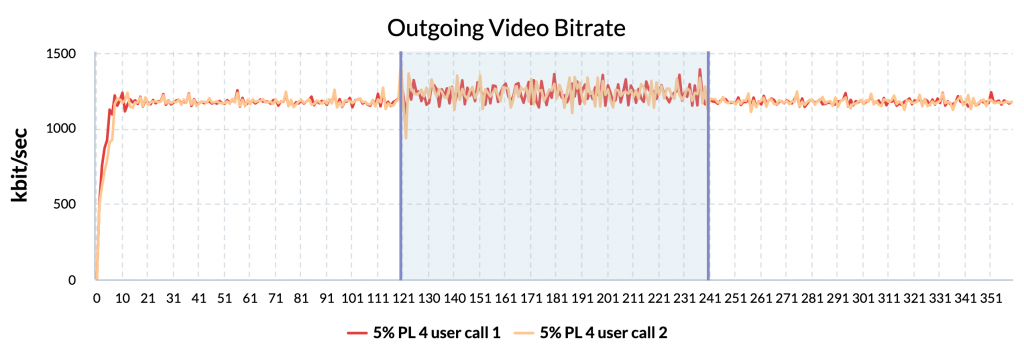
Video outgoing bitrate
Overview:
- Long recovery from packet loss
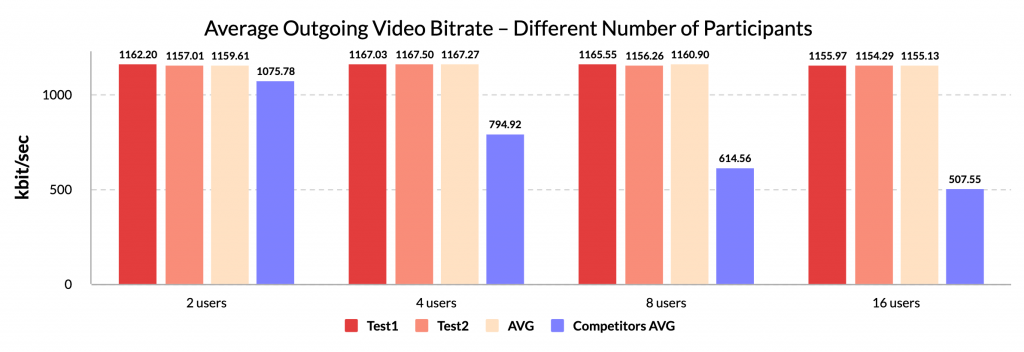
In the case of 100ms “Different number of participants” and “Multiple region” tests have an outgoing bitrate of 1160 kbit/sec on average for all tests. The situation with competitors is different – the outgoing bitrate drops as the amount of users in a call rises.
During 100% packet loss the outgoing bitrate decreases by 80 to 100 percent and recovers in a 30 – 40 seconds time frame, whereas 5% packet loss results in increased instability for the outgoing bitrate.
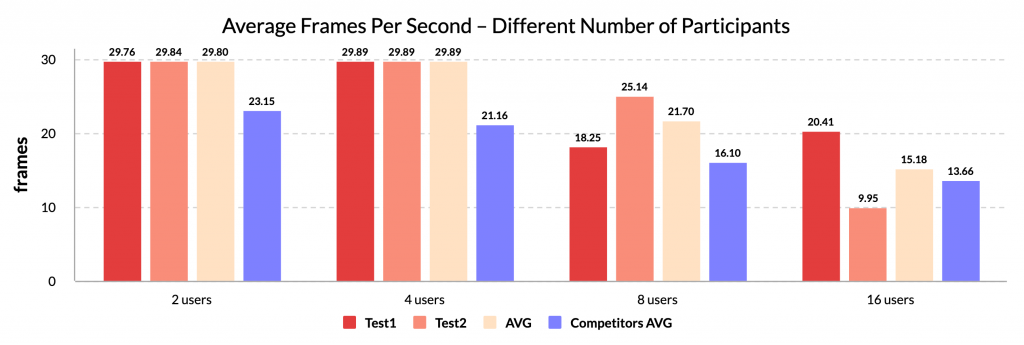
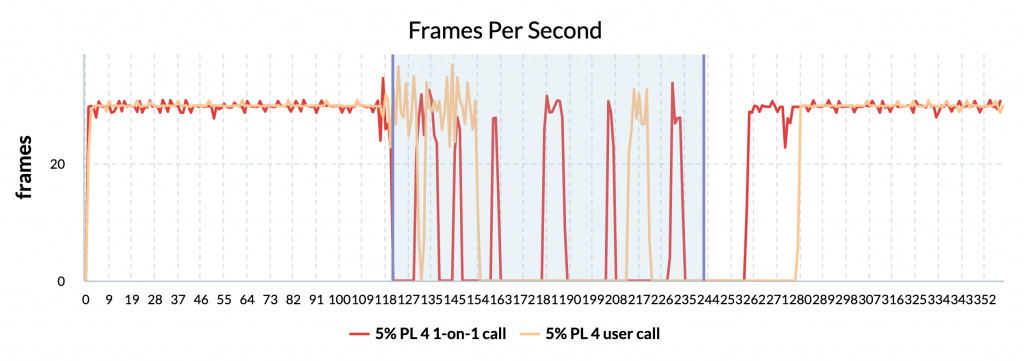
Video incoming FPS
Overview:
- FPS is higher than the competition in tests with stable performance
- FPS isn’t stable across the tests and has significant drops and spikes
30 FPS for 100ms and ~23 FPS for the competitors is the stable performance that can be seen in all multiple region tests, as well as in 2-user tests and 4-user tests.
The story becomes different in 8 and 16 user tests, where FPS drops to 0, fluctuates by 10 frames every 2 seconds and has spikes up to 58 fps. Again, we are not entirely sure what causes this. We think that it could be because the participant video is not shown during the call because there are more dominant attendees. Another explanation could be that 100ms couldn’t handle this number of concurrent callers.
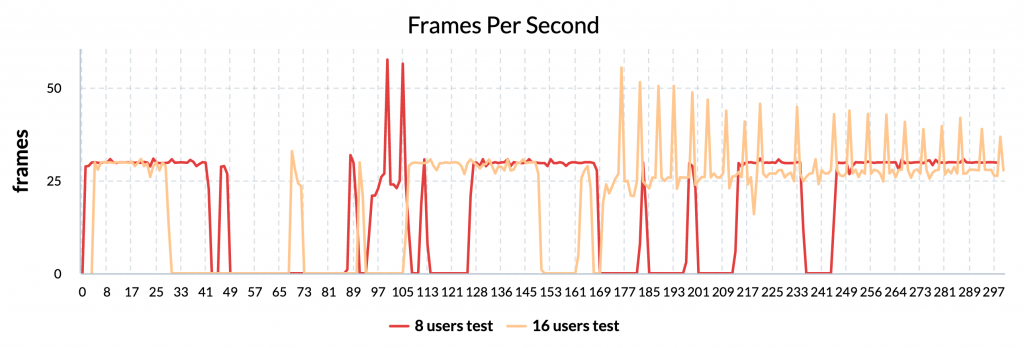
In the case of 100% packet loss calls with 4 users, similar fluctuations for incoming FPS can be seen, along with 60+ FPS spikes.
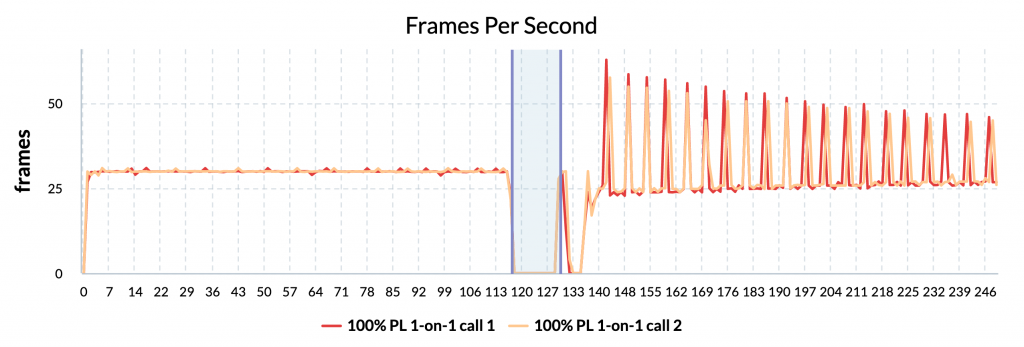
The same as for incoming bitrate, shortly after applying 5% packet loss FPS experiences constant drops to 0 frames and recovers from them 20-40 seconds after the end of the limitation period.
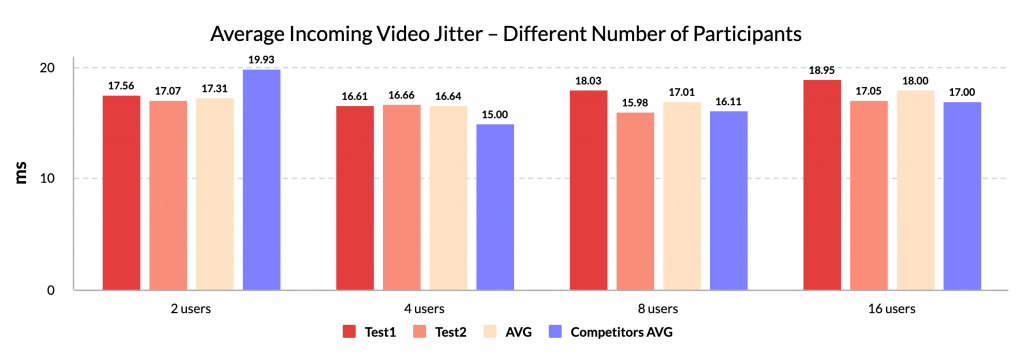
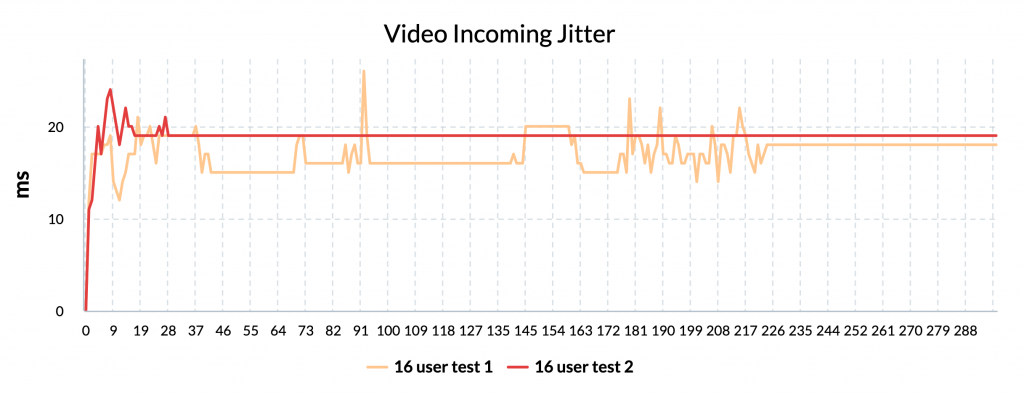
Video incoming jitter
Overview
- Slight deviations of jitter across performance across tests
For both 100ms and competitors the averages of incoming video jitter looks stable across all the tests with 17 ms on average and +- 2 ms deviation.
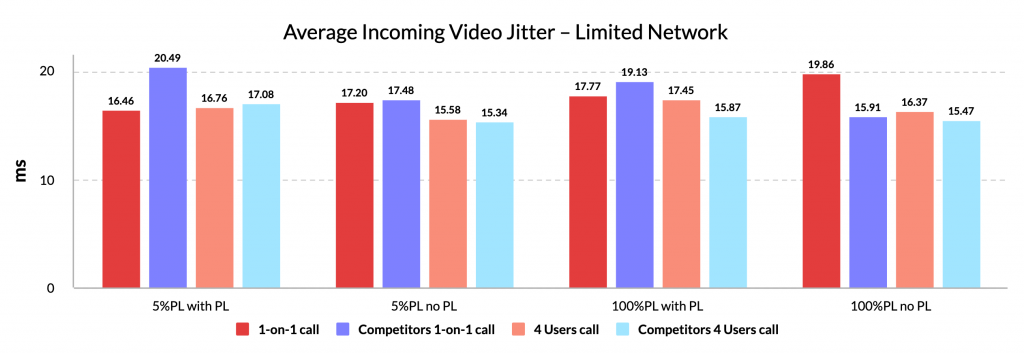
The graphs representing incoming jitter change over time show a different story though. Most of the participants in limited network tests (both with packet loss applied and without) had significant jitter spikes – from 70 to 200+ ms. The spikes primarily happened during the period of limited internet, but for some tests outside that timeframe as well.
This behavior was also seen in 8-user tests.
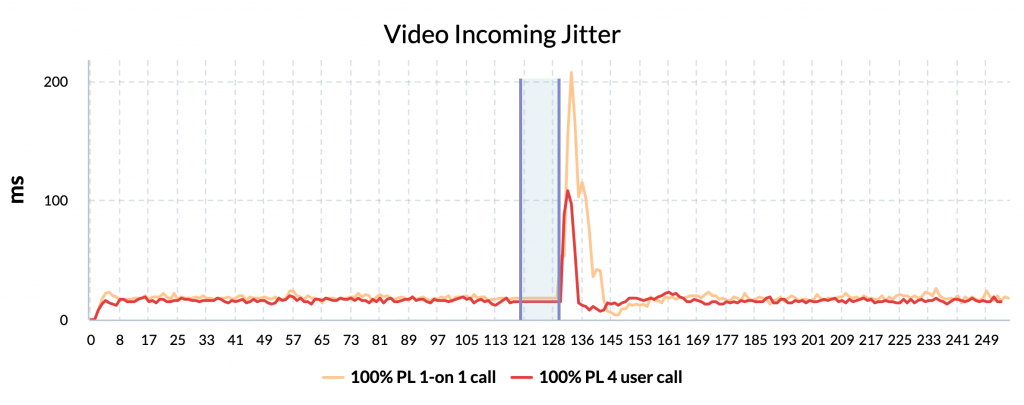
During the periods of no incoming video bitrate, the jitter stalled and stayed unchanged until the next period with incoming video bitrate, which is best seen in the 16-participant test.
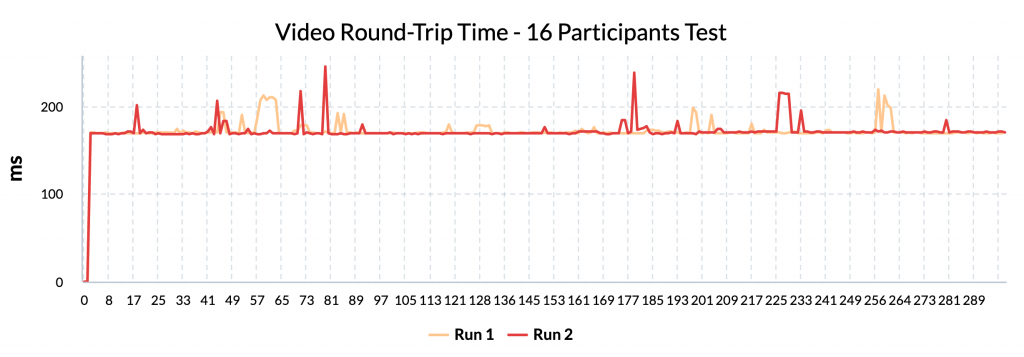
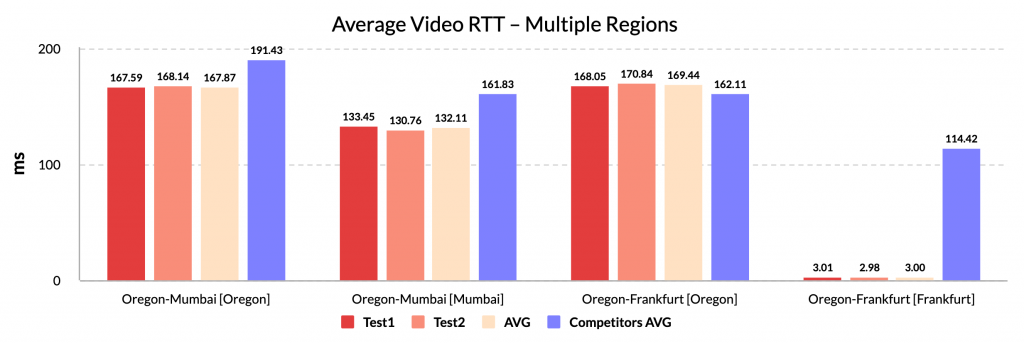
Round-trip time (RTT)
Overview:
- Stable results during testing
Unlike competitors, 100ms shows stable RTT across all tests with zero to none fluctuations, exception being the 16-participant test, where round-trip time was occasionally spiking to 200ms – 240ms (for Oregon) for up to 8 seconds.
Average round-trip time depending on the location of the 2 users
| Direction | User’s Location | 100ms results (ms) | Competitors results (ms) |
| Oregon – Oregon – Oregon | Oregon | 168 | 80 |
| Oregon – Mumbai – Oregon | Oregon | 168 | 191 |
| Mumbai – Oregon – Mumbai | Mumbai | 132 | 162 |
| Oregon – Frankfurt – Oregon | Oregon | 169 | 162 |
| Frankfurt – Oregon – Frankfurt | Frankfurt | 3 | 114 |
Conclusions
In summary, the findings revealed both the strengths and weaknesses of the 100ms platform.
The strengths:
- When compared to competitors, the 100ms platform demonstrated competitive performance in terms of stable round-trip time (RTT) and higher video frames per second (FPS).
- It outperformed competitors in audio jitter for tests with multiple participants.
These strengths indicate that the 100ms platform can provide a reliable and smooth communication experience in terms of audio and video quality. However, the research also identified areas where the 100ms platform could be improved.
The weaknesses:
- The platform exhibited higher average CPU usage compared to competitors, with occasional bursts of high CPU usage. This indicates a potential efficiency concern that could impact scalability and resource utilization.
- In terms of audio bitrate, the 100ms platform showed slightly lower performance compared to competitors, which may affect the overall audio quality in certain scenarios.
- Additionally, the stability of video performance in tests with higher participant numbers was a weakness of the 100ms platform. It experienced drops in video bitrate and frames per second, leading to a less consistent user experience during group calls.
Disclaimer
The following blog post is not sponsored by 100ms or any other company. The vendor was not a customer of Loadero at the time the research was conducted and this blog post published. All the testing and analysis were done strictly by the Loadero team by our own initiative as a part of research.
The findings provided in this report reflect Loadero testing results from tests executed on December 29th, 2022.
Additional information
Scripts used for tests
- Different number of participants / multiple regions tests
client => {
  client
    .url(`https://loaderotest.app.100ms.live/meeting/qwn-zez-jfa`)

    // Enter the user name
    .waitForElementVisible('[id="name"]', 30 * 1000)
    .sendKeys('[id="name"]', "User")

    // Press Join
    .waitForElementVisible('[type="submit"]', 10 * 1000)
    .click('[type="submit"]')

    // Stay in the call for 3 minutes
    .pause(3 * 60 * 1000)

    // Take a screenshot mid-call
    .takeScreenshot("100ms_call.png")

    // Stay in the call for 2 more minutes
    .pause(2 * 60 * 1000);
};
- 5% packet loss tests
client => {
  client
    .url(`https://loaderotest.app.100ms.live/meeting/qwn-zez-jfa`)

    // Enter the user name
    .waitForElementVisible('[id="name"]', 30 * 1000)
    .sendKeys('[id="name"]', "User")

    // Press Join
    .waitForElementVisible('[type="submit"]', 10 * 1000)
    .click('[type="submit"]')

    // 2 minutes with unlimited network
    // For all of the participants
    .pause(1 * 60 * 1000)
    .takeScreenshot("100ms_before_packetloss.png")
    .pause(1 * 60 * 1000);

  // 2 minutes with packet loss
  // For one of the participants
  if (client.globals.participant.globalID === 0) {
    client.updateNetwork(loaderoConstants.network.packetloss5);
  }

  client
    .pause(1 * 60 * 1000)
    .takeScreenshot("100ms_during_packetloss.png")
    .pause(1 * 60 * 1000);

  // 2 minutes with unlimited network
  // For all of the participants
  client
    .updateNetwork(loaderoConstants.network.default)
    .pause(1 * 60 * 1000)
    .takeScreenshot("100ms_after_packetloss.png")
    .pause(1 * 60 * 1000);
};
- 100% packet loss tests
client => {
  client
    .url(`https://loaderotest.app.100ms.live/meeting/qwn-zez-jfa`)

    // Enter the user name
    .waitForElementVisible('[id="name"]', 30 * 1000)
    .sendKeys('[id="name"]', "User")

    // Press Join
    .waitForElementVisible('[type="submit"]', 10 * 1000)
    .click('[type="submit"]')

    // 2 minutes with unlimited network
    // For all of the participants
    .pause(1 * 60 * 1000)
    .takeScreenshot("100ms_before_packetloss.png")
    .pause(1 * 60 * 1000);

  // 10 seconds with packetloss
  // For one of the participants
  if (client.globals.participant.globalID === 0) {
    client.updateNetwork(loaderoConstants.network.packetloss100);
  }
  client
    .pause(5 * 1000)
    .takeScreenshot("100ms_during_packetloss.png")
    .pause(5 * 1000);

  // 2 minutes with unlimited network
  // For all of the participants
  client
    .updateNetwork(loaderoConstants.network.default)
    .pause(1 * 60 * 1000)
    .takeScreenshot("100ms_after_packetloss.png")
    .pause(1 * 60 * 1000);
};